
- Start >
- Rivers >
- Waterlevel >
- Iller - Lech - Bodensee >
- Aeschach >
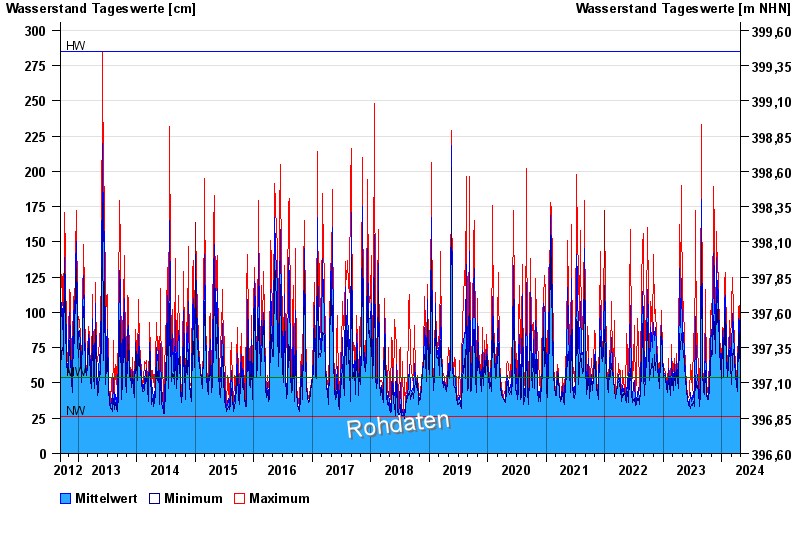
- Chart of total period

Chart of total period Aeschach / Oberreitnauer Ach
Waterlevel from 12.09.2012 to 28.04.2024
| Date | Mean value [cm] | Maximum [cm] | Minimum [cm] |
|---|---|---|---|
| 28.04.2024 | 47 | 48 | 46 |
| 27.04.2024 | 49 | 50 | 48 |
| 26.04.2024 | 52 | 54 | 50 |
| 25.04.2024 | 56 | 58 | 54 |
| 24.04.2024 | 60 | 62 | 58 |
| 23.04.2024 | 66 | 71 | 62 |
| 22.04.2024 | 78 | 85 | 72 |
© Bayerisches Landesamt für Umwelt 2024