
- Start >
- Rivers >
- Waterlevel >
- Oberer Main - Elbe >
- Wallenfels >
- Chart of total period

Chart of total period Wallenfels / Wilde Rodach
Waterlevel from 01.11.1976 to 27.04.2024
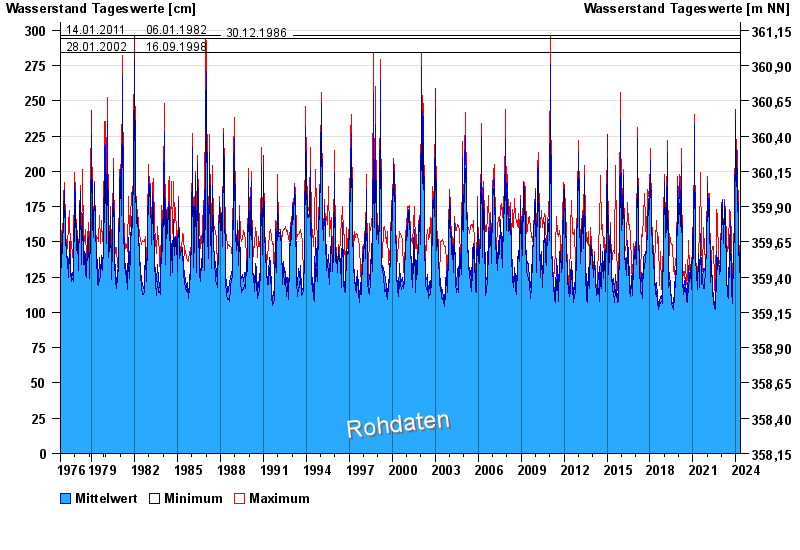
- 14.01.2011 Wasserstand: 296 cm
- 06.01.1982 Wasserstand: 296 cm
- 30.12.1986 Wasserstand: 294 cm
- 28.01.2002 Wasserstand: 284 cm
- 16.09.1998 Wasserstand: 284 cm
| Date | Mean value [cm] | Maximum [cm] | Minimum [cm] |
|---|---|---|---|
| 27.04.2024 | 132 | 132 | 131 |
| 26.04.2024 | 133 | 135 | 132 |
| 25.04.2024 | 136 | 139 | 135 |
| 24.04.2024 | 135 | 136 | 134 |
| 23.04.2024 | 135 | 136 | 135 |
| 22.04.2024 | 135 | 135 | 134 |
| 21.04.2024 | 134 | 135 | 133 |
© Bayerisches Landesamt für Umwelt 2024