
- Start >
- Rivers >
- Waterlevel >
- Oberer Main - Elbe >
- Unterlangenstadt >
- Chart of year

Chart of year Unterlangenstadt / Rodach
Waterlevel from 27.01.2023 to 26.01.2024
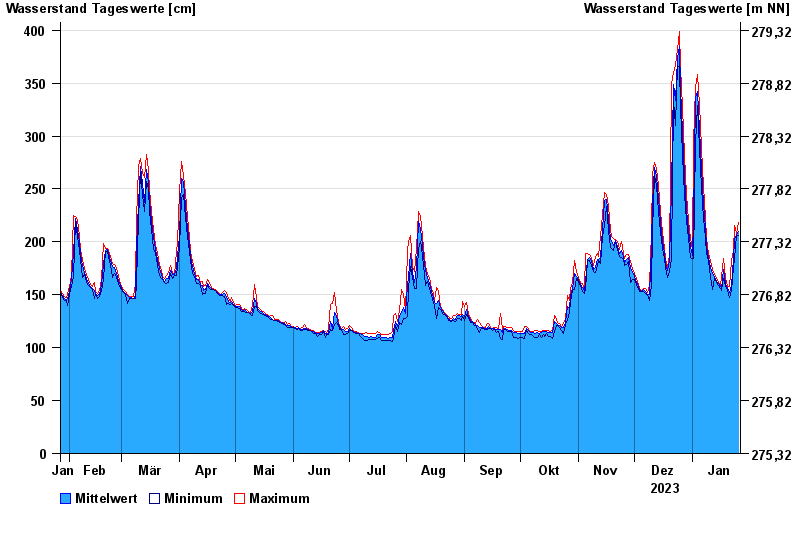
| Date | Mean value [cm] | Maximum [cm] | Minimum [cm] |
|---|---|---|---|
| 26.01.2024 | 210 | 218 | 206 |
| 25.01.2024 | 207 | 208 | 206 |
| 24.01.2024 | 202 | 215 | 184 |
| 23.01.2024 | 184 | 192 | 176 |
| 22.01.2024 | 159 | 182 | 154 |
| 21.01.2024 | 152 | 158 | 147 |
| 20.01.2024 | 156 | 158 | 154 |
© Bayerisches Landesamt für Umwelt 2024