
- Start >
- Rivers >
- Waterlevel >
- Oberer Main - Elbe >
- Unterlangenstadt >
- Chart of year

Chart of year Unterlangenstadt / Rodach
Waterlevel from 18.01.2022 to 17.01.2023
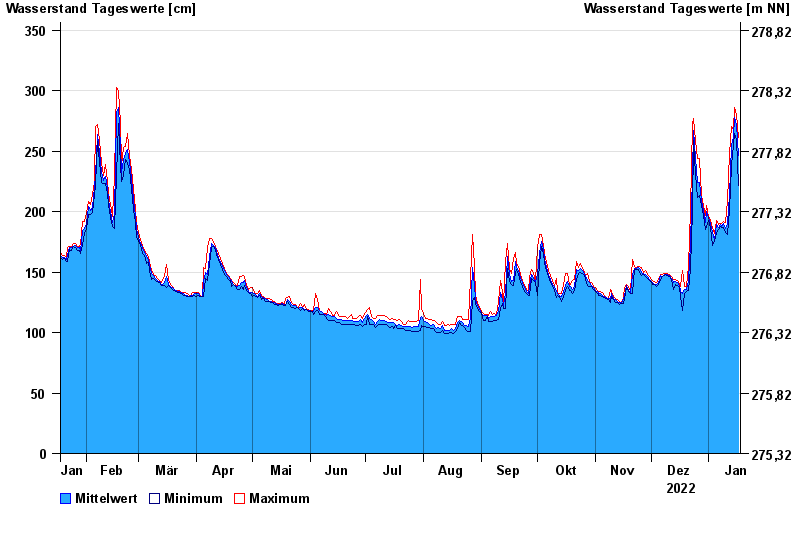
| Date | Mean value [cm] | Maximum [cm] | Minimum [cm] |
|---|---|---|---|
| 17.01.2023 | 246 | 261 | 222 |
| 16.01.2023 | 272 | 280 | 260 |
| 15.01.2023 | 278 | 286 | 265 |
| 14.01.2023 | 261 | 268 | 255 |
| 13.01.2023 | 255 | 270 | 238 |
| 12.01.2023 | 213 | 248 | 201 |
| 11.01.2023 | 190 | 209 | 181 |
© Bayerisches Landesamt für Umwelt 2024