
- Start >
- Rivers >
- Waterlevel >
- Oberer Main - Elbe >
- Unterlangenstadt >
- Chart of year

Chart of year Unterlangenstadt / Rodach
Waterlevel from 01.01.2024 to 01.05.2024
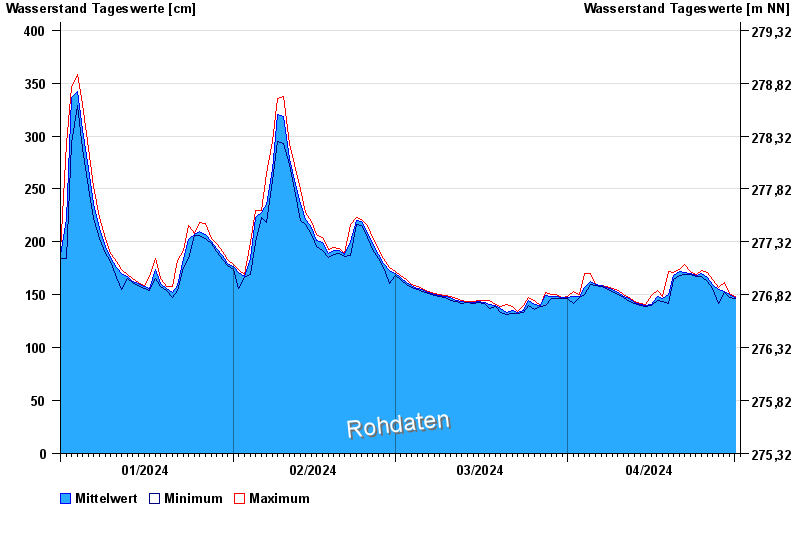
| Date | Mean value [cm] | Maximum [cm] | Minimum [cm] |
|---|---|---|---|
| 01.05.2024 | 147 | 148 | 146 |
| 30.04.2024 | 150 | 151 | 147 |
| 29.04.2024 | 153 | 162 | 152 |
| 28.04.2024 | 155 | 157 | 142 |
| 27.04.2024 | 160 | 164 | 156 |
| 26.04.2024 | 166 | 171 | 163 |
| 25.04.2024 | 170 | 173 | 167 |
© Bayerisches Landesamt für Umwelt 2024