
- Start >
- Rivers >
- Waterlevel >
- Oberer Main - Elbe >
- Unterlangenstadt >
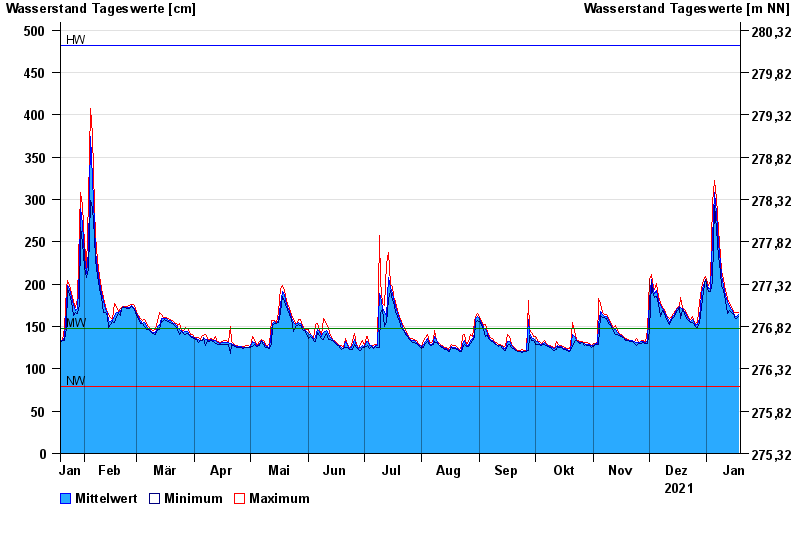
- Chart of year

Chart of year Unterlangenstadt / Rodach
Waterlevel from 19.01.2021 to 18.01.2022
| Date | Mean value [cm] | Maximum [cm] | Minimum [cm] |
|---|---|---|---|
| 18.01.2022 | 164 | 166 | 162 |
| 17.01.2022 | 162 | 166 | 160 |
| 16.01.2022 | 163 | 166 | 161 |
| 15.01.2022 | 166 | 168 | 165 |
| 14.01.2022 | 170 | 172 | 167 |
| 13.01.2022 | 174 | 177 | 169 |
| 12.01.2022 | 179 | 183 | 165 |
© Bayerisches Landesamt für Umwelt 2024