
- Start >
- Rivers >
- Waterlevel >
- Oberer Main - Elbe >
- Unterbruck Flutmulde >
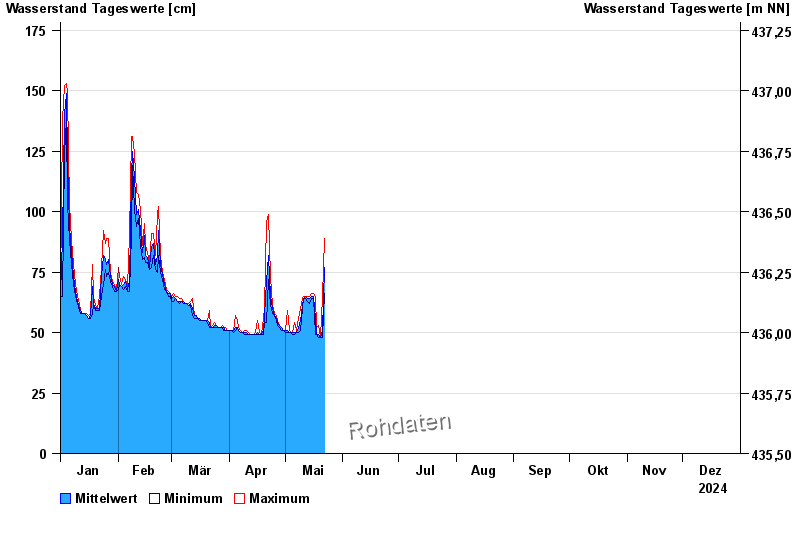
- Chart of year

Chart of year Unterbruck Flutmulde / Haidenaab
Waterlevel from 01.01.2024 to 31.12.2024
| Date | Mean value [cm] | Maximum [cm] | Minimum [cm] |
|---|---|---|---|
| 29.05.2024 | 53 | 53 | 53 |
| 28.05.2024 | 54 | 56 | 53 |
| 27.05.2024 | 53 | 53 | 52 |
| 26.05.2024 | 56 | 59 | 53 |
| 25.05.2024 | 56 | 62 | 55 |
| 24.05.2024 | 58 | 60 | 57 |
| 23.05.2024 | 65 | 80 | 60 |
© Bayerisches Landesamt für Umwelt 2024