
- Start >
- Rivers >
- Waterlevel >
- Oberer Main - Elbe >
- Seebruck >
- Chart of year

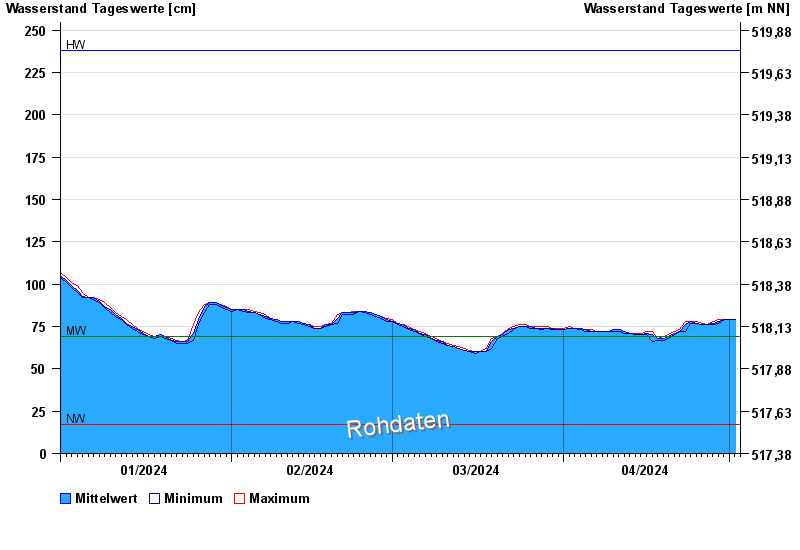
Chart of year Seebruck / Alz
Waterlevel from 01.01.2024 to 02.05.2024
| Date | Mean value [cm] | Maximum [cm] | Minimum [cm] |
|---|---|---|---|
| 02.05.2024 | 79 | 79 | 79 |
| 01.05.2024 | 79 | 79 | 79 |
| 30.04.2024 | 79 | 79 | 79 |
| 29.04.2024 | 78 | 79 | 77 |
| 28.04.2024 | 77 | 78 | 76 |
| 27.04.2024 | 76 | 76 | 76 |
| 26.04.2024 | 76 | 77 | 76 |
© Bayerisches Landesamt für Umwelt 2024