
- Start >
- Rivers >
- Waterlevel >
- Oberer Main - Elbe >
- Schenkenau >
- Chart of year

Chart of year Schenkenau / Itz
Waterlevel from 20.04.2024 to 19.04.2025
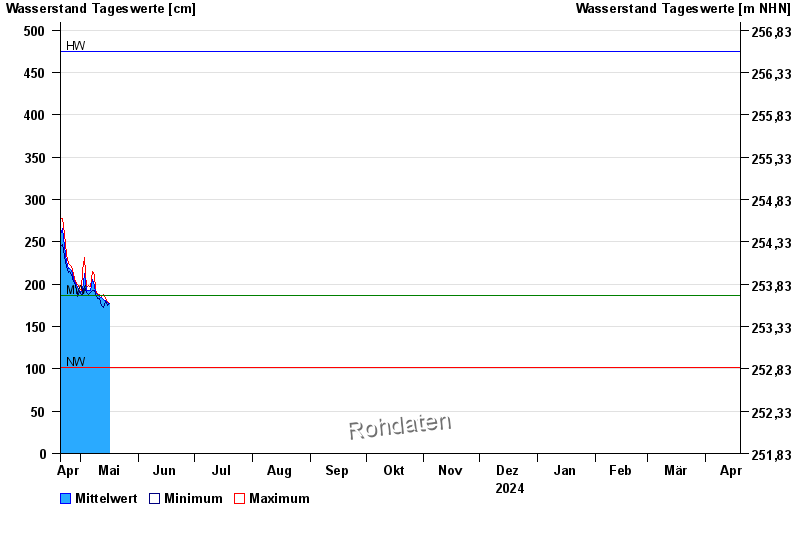
| Date | Mean value [cm] | Maximum [cm] | Minimum [cm] |
|---|---|---|---|
| 02.05.2024 | 190 | 190 | 190 |
| 01.05.2024 | 191 | 193 | 188 |
| 30.04.2024 | 193 | 195 | 191 |
| 29.04.2024 | 196 | 200 | 186 |
| 28.04.2024 | 201 | 203 | 199 |
| 27.04.2024 | 207 | 211 | 203 |
| 26.04.2024 | 216 | 221 | 211 |
© Bayerisches Landesamt für Umwelt 2024