
- Start >
- Rivers >
- Waterlevel >
- Oberer Main - Elbe >
- Schenkenau >
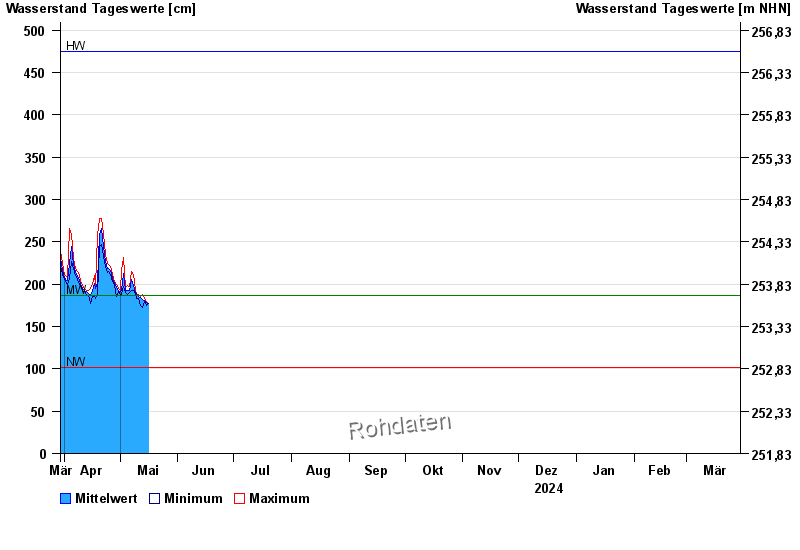
- Chart of year

Chart of year Schenkenau / Itz
Waterlevel from 30.03.2024 to 29.03.2025
| Date | Mean value [cm] | Maximum [cm] | Minimum [cm] |
|---|---|---|---|
| 15.05.2024 | 178 | 180 | 176 |
| 14.05.2024 | 181 | 183 | 180 |
| 13.05.2024 | 182 | 188 | 172 |
| 12.05.2024 | 184 | 186 | 175 |
| 11.05.2024 | 186 | 188 | 183 |
| 10.05.2024 | 188 | 189 | 183 |
| 09.05.2024 | 190 | 192 | 188 |
© Bayerisches Landesamt für Umwelt 2024