
- Start >
- Rivers >
- Waterlevel >
- Oberer Main - Elbe >
- Pfarrweisach >
- Chart of year

Chart of year Pfarrweisach / Weisach
Waterlevel from 04.02.2024 to 03.02.2025
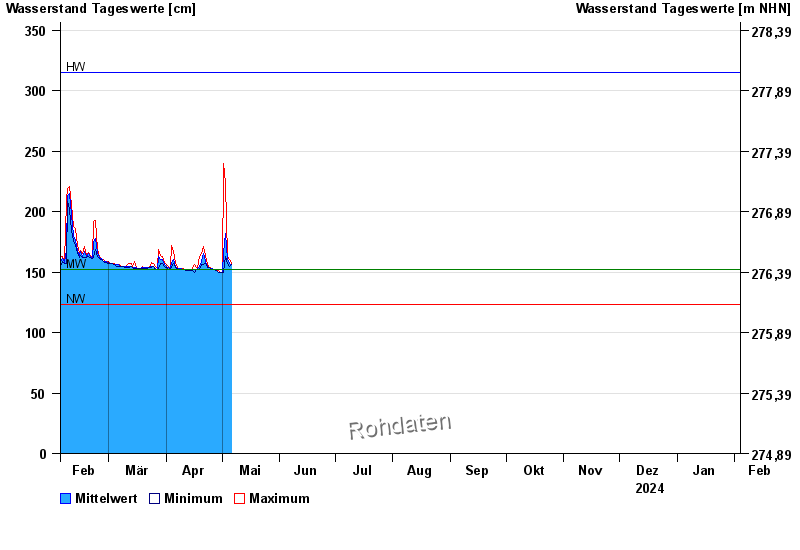
| Date | Mean value [cm] | Maximum [cm] | Minimum [cm] |
|---|---|---|---|
| 06.05.2024 | 156 | 157 | 156 |
| 05.05.2024 | 157 | 160 | 155 |
| 04.05.2024 | 160 | 163 | 157 |
| 03.05.2024 | 182 | 223 | 163 |
| 02.05.2024 | 166 | 240 | 150 |
| 01.05.2024 | 150 | 150 | 150 |
| 30.04.2024 | 150 | 150 | 150 |
© Bayerisches Landesamt für Umwelt 2024