
- Start >
- Rivers >
- Waterlevel >
- Oberer Main - Elbe >
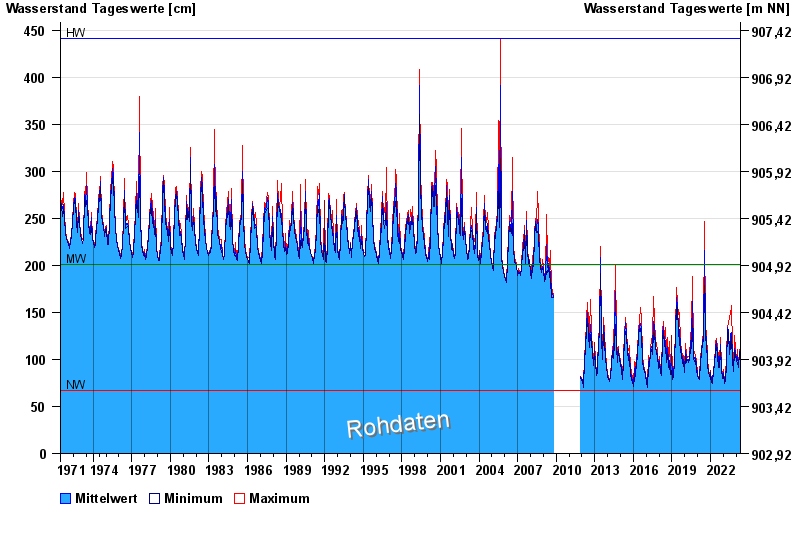
- Mittenwald >
- Chart of total period

Chart of total period Mittenwald / Isar
Waterlevel from 15.06.1971 to 01.05.2024
| Date | Mean value [cm] | Maximum [cm] | Minimum [cm] |
|---|---|---|---|
| 01.05.2024 | 102 | 105 | 100 |
| 30.04.2024 | 102 | 105 | 100 |
| 29.04.2024 | 100 | 103 | 98 |
| 28.04.2024 | 98 | 102 | 96 |
| 27.04.2024 | 97 | 99 | 95 |
| 26.04.2024 | 97 | 98 | 96 |
| 25.04.2024 | 97 | 99 | 96 |
© Bayerisches Landesamt für Umwelt 2024