
- Start >
- Rivers >
- Waterlevel >
- Oberer Main - Elbe >
- Leucherhof >
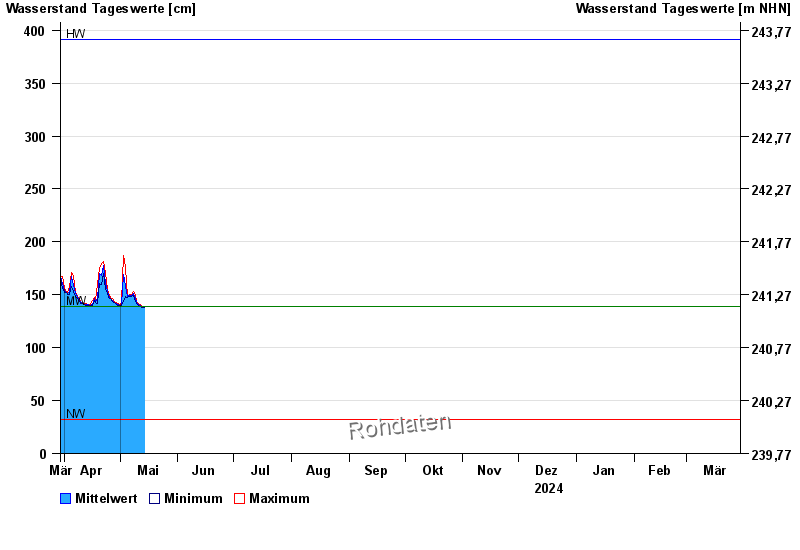
- Chart of year

Chart of year Leucherhof / Baunach
Waterlevel from 30.03.2024 to 29.03.2025
| Date | Mean value [cm] | Maximum [cm] | Minimum [cm] |
|---|---|---|---|
| 24.05.2024 | 249 | 249 | 249 |
| 23.05.2024 | 246 | 250 | 235 |
| 22.05.2024 | 219 | 234 | 199 |
| 21.05.2024 | 149 | 198 | 139 |
| 20.05.2024 | 143 | 144 | 142 |
| 19.05.2024 | 141 | 143 | 140 |
| 18.05.2024 | 142 | 143 | 140 |
© Bayerisches Landesamt für Umwelt 2024