
- Start >
- Rivers >
- Waterlevel >
- Oberer Main - Elbe >
- Laufermühle >
- Chart of year

Chart of year Laufermühle / Aisch
Waterlevel from 28.02.2021 to 27.02.2022
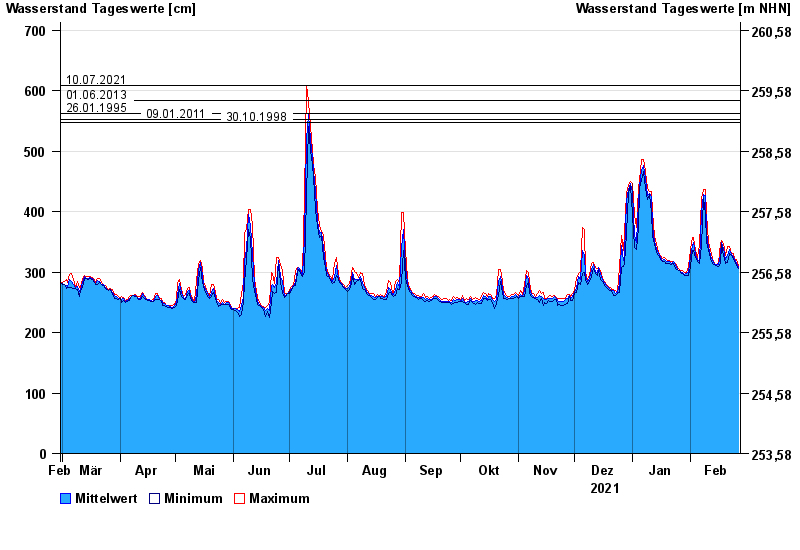
- 10.07.2021 Wasserstand: 609 cm
- 01.06.2013 Wasserstand: 584 cm
- 26.01.1995 Wasserstand: 563 cm
- 09.01.2011 Wasserstand: 553 cm
- 30.10.1998 Wasserstand: 548 cm
| Date | Mean value [cm] | Maximum [cm] | Minimum [cm] |
|---|---|---|---|
| 27.02.2022 | 308 | 311 | 306 |
| 26.02.2022 | 315 | 321 | 311 |
| 25.02.2022 | 321 | 322 | 319 |
| 24.02.2022 | 326 | 330 | 321 |
| 23.02.2022 | 329 | 331 | 327 |
| 22.02.2022 | 338 | 343 | 330 |
| 21.02.2022 | 328 | 342 | 316 |
© Bayerisches Landesamt für Umwelt 2024