
- Start >
- Rivers >
- Waterlevel >
- Oberer Main - Elbe >
- Laufermühle >
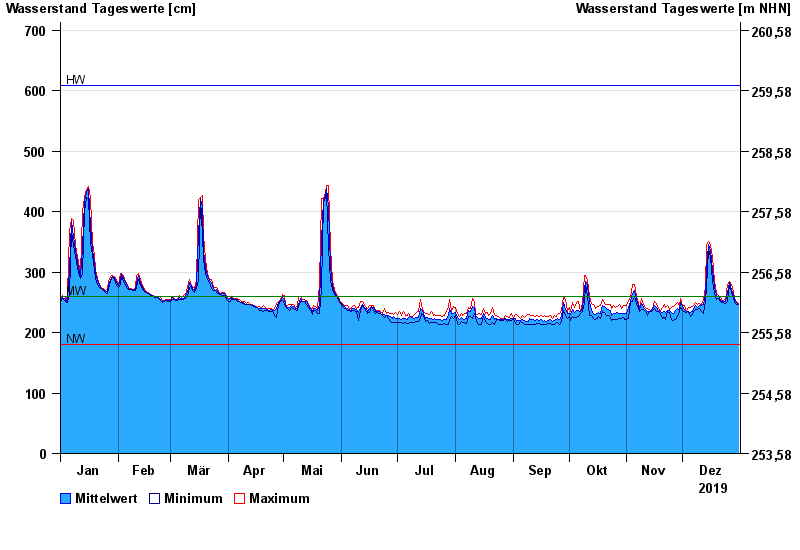
- Chart of year

Chart of year Laufermühle / Aisch
Waterlevel from 01.01.2019 to 31.12.2019
| Date | Mean value [cm] | Maximum [cm] | Minimum [cm] |
|---|---|---|---|
| 31.12.2019 | 247 | 248 | 246 |
| 30.12.2019 | 249 | 251 | 247 |
| 29.12.2019 | 254 | 257 | 250 |
| 28.12.2019 | 262 | 266 | 257 |
| 27.12.2019 | 272 | 279 | 266 |
| 26.12.2019 | 282 | 285 | 279 |
| 25.12.2019 | 267 | 280 | 251 |
© Bayerisches Landesamt für Umwelt 2024