
- Start >
- Rivers >
- Waterlevel >
- Oberer Main - Elbe >
- Laufermühle >
- Chart of year

Chart of year Laufermühle / Aisch
Waterlevel from 01.01.2018 to 31.12.2018
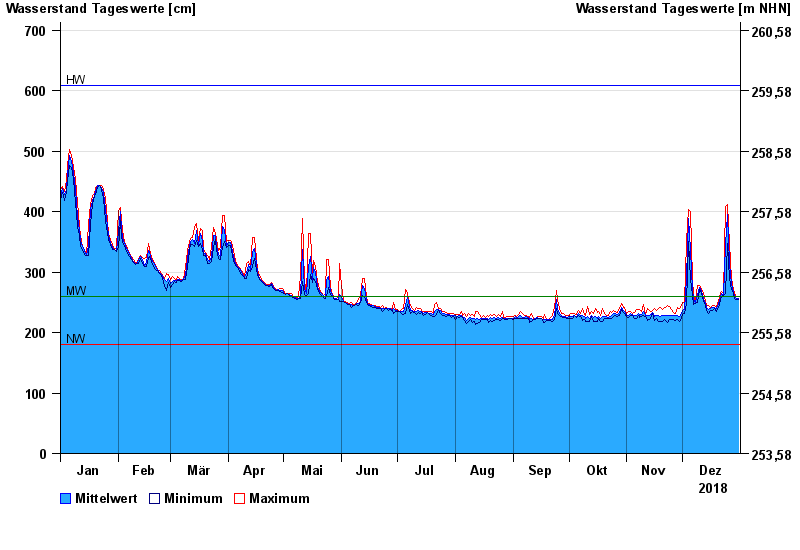
| Date | Mean value [cm] | Maximum [cm] | Minimum [cm] |
|---|---|---|---|
| 31.12.2018 | 257 | 259 | 255 |
| 30.12.2018 | 257 | 259 | 254 |
| 29.12.2018 | 260 | 264 | 257 |
| 28.12.2018 | 268 | 272 | 264 |
| 27.12.2018 | 279 | 290 | 272 |
| 26.12.2018 | 314 | 347 | 290 |
| 25.12.2018 | 396 | 411 | 347 |
© Bayerisches Landesamt für Umwelt 2024