
- Start >
- Rivers >
- Waterlevel >
- Oberer Main - Elbe >
- Laufermühle >
- Chart of total period

Chart of total period Laufermühle / Aisch
Waterlevel from 01.11.1963 to 27.04.2024
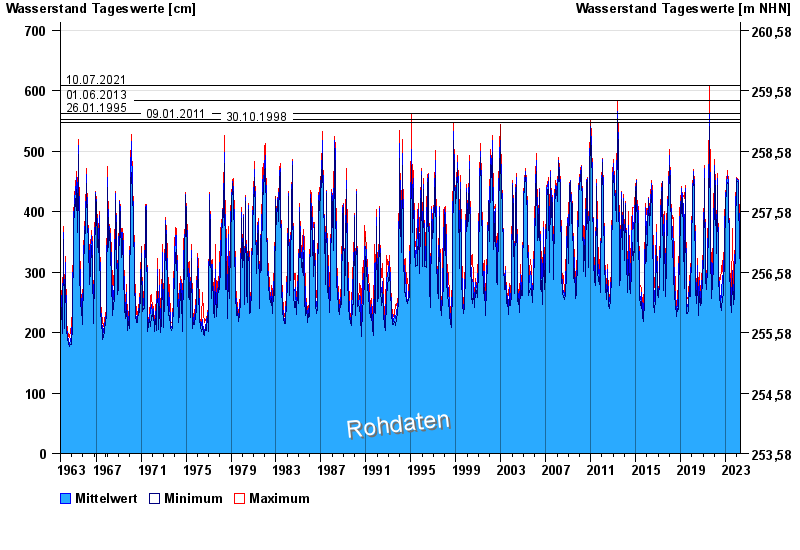
- 10.07.2021 Wasserstand: 609 cm
- 01.06.2013 Wasserstand: 584 cm
- 26.01.1995 Wasserstand: 563 cm
- 09.01.2011 Wasserstand: 553 cm
- 30.10.1998 Wasserstand: 548 cm
| Date | Mean value [cm] | Maximum [cm] | Minimum [cm] |
|---|---|---|---|
| 27.04.2024 | 281 | 281 | 281 |
| 26.04.2024 | 283 | 285 | 280 |
| 25.04.2024 | 285 | 287 | 284 |
| 24.04.2024 | 291 | 298 | 287 |
| 23.04.2024 | 314 | 331 | 298 |
| 22.04.2024 | 348 | 357 | 331 |
| 21.04.2024 | 317 | 335 | 305 |
© Bayerisches Landesamt für Umwelt 2024