
- Start >
- Rivers >
- Waterlevel >
- Oberer Main - Elbe >
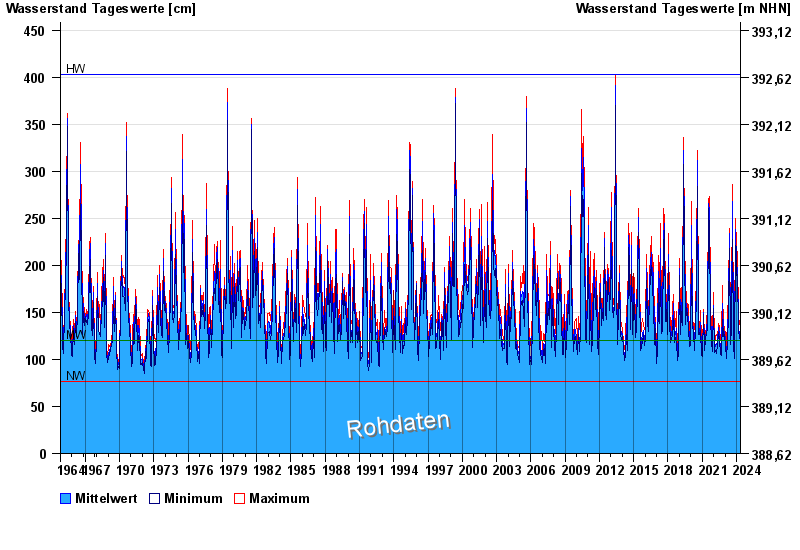
- Landshut Birket >
- Chart of total period

Chart of total period Landshut Birket / Isar
Waterlevel from 01.11.1964 to 06.05.2024
| Date | Mean value [cm] | Maximum [cm] | Minimum [cm] |
|---|---|---|---|
| 06.05.2024 | 117 | 117 | 117 |
| 05.05.2024 | 116 | 126 | 106 |
| 04.05.2024 | 117 | 118 | 114 |
| 03.05.2024 | 117 | 119 | 115 |
| 02.05.2024 | 117 | 122 | 112 |
| 01.05.2024 | 125 | 127 | 119 |
| 30.04.2024 | 126 | 127 | 123 |
© Bayerisches Landesamt für Umwelt 2024