
- Start >
- Rivers >
- Waterlevel >
- Oberer Main - Elbe >
- Hohenberg >
- Chart of year

Chart of year Hohenberg / Eger
Waterlevel from 30.03.2024 to 29.03.2025
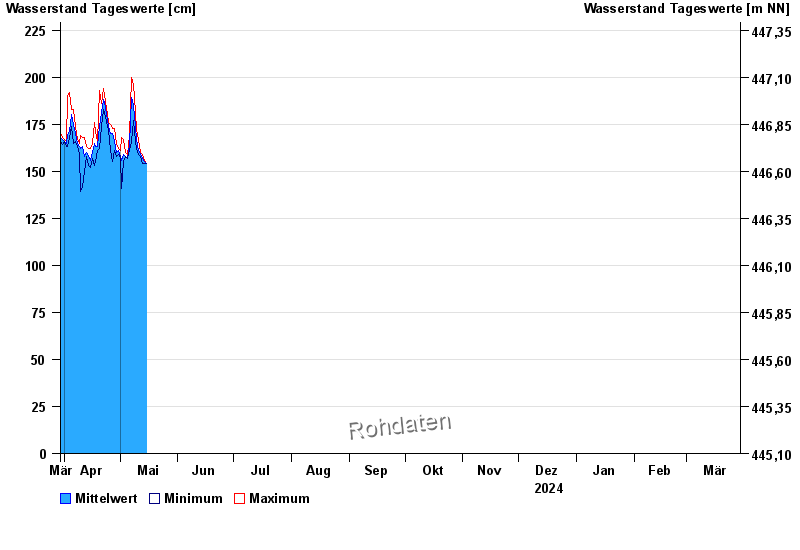
| Date | Mean value [cm] | Maximum [cm] | Minimum [cm] |
|---|---|---|---|
| 15.05.2024 | 154 | 154 | 154 |
| 14.05.2024 | 155 | 156 | 154 |
| 13.05.2024 | 157 | 159 | 154 |
| 12.05.2024 | 159 | 160 | 158 |
| 11.05.2024 | 161 | 167 | 159 |
| 10.05.2024 | 167 | 172 | 162 |
| 09.05.2024 | 174 | 181 | 166 |
© Bayerisches Landesamt für Umwelt 2024