
- Start >
- Rivers >
- Waterlevel >
- Oberer Main - Elbe >
- Hohenberg >
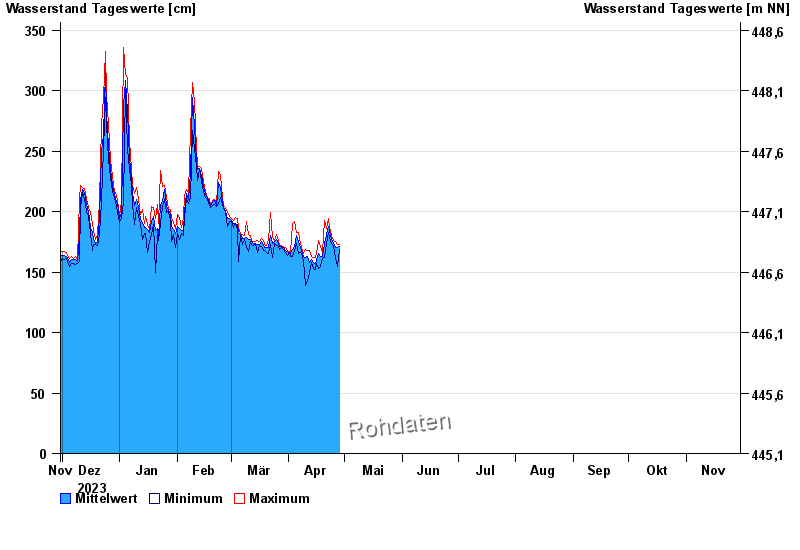
- Chart of year

Chart of year Hohenberg / Eger
Waterlevel from 30.11.2023 to 29.11.2024
| Date | Mean value [cm] | Maximum [cm] | Minimum [cm] |
|---|---|---|---|
| 23.05.2024 | 196 | 197 | 196 |
| 22.05.2024 | 189 | 207 | 160 |
| 21.05.2024 | 153 | 160 | 148 |
| 20.05.2024 | 156 | 164 | 148 |
| 19.05.2024 | 155 | 165 | 149 |
| 18.05.2024 | 155 | 160 | 148 |
| 17.05.2024 | 153 | 161 | 150 |
© Bayerisches Landesamt für Umwelt 2024