
- Start >
- Rivers >
- Waterlevel >
- Oberer Main - Elbe >
- Hohenberg >
- Chart of year

Chart of year Hohenberg / Eger
Waterlevel from 30.03.2024 to 29.03.2025
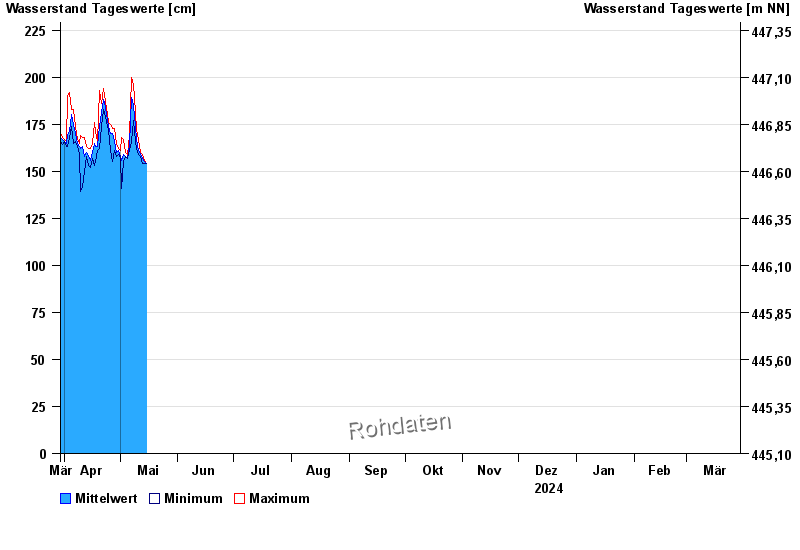
| Date | Mean value [cm] | Maximum [cm] | Minimum [cm] |
|---|---|---|---|
| 29.04.2024 | 161 | 164 | 158 |
| 28.04.2024 | 166 | 173 | 161 |
| 27.04.2024 | 170 | 173 | 155 |
| 26.04.2024 | 170 | 175 | 161 |
| 25.04.2024 | 174 | 176 | 172 |
| 24.04.2024 | 177 | 180 | 174 |
| 23.04.2024 | 184 | 187 | 179 |
© Bayerisches Landesamt für Umwelt 2024