
- Start >
- Rivers >
- Waterlevel >
- Oberer Main - Elbe >
- Hohenberg >
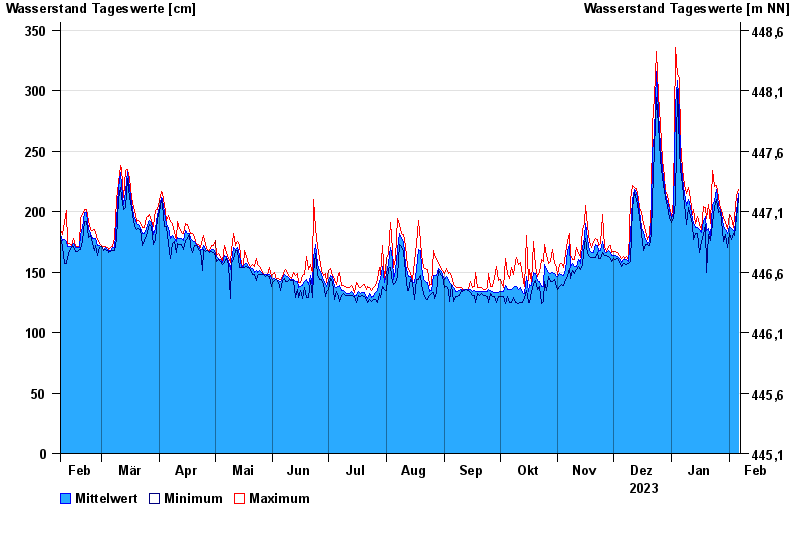
- Chart of year

Chart of year Hohenberg / Eger
Waterlevel from 07.02.2023 to 06.02.2024
| Date | Mean value [cm] | Maximum [cm] | Minimum [cm] |
|---|---|---|---|
| 06.02.2024 | 215 | 218 | 211 |
| 05.02.2024 | 200 | 213 | 195 |
| 04.02.2024 | 184 | 195 | 180 |
| 03.02.2024 | 184 | 187 | 182 |
| 02.02.2024 | 186 | 195 | 177 |
| 01.02.2024 | 188 | 198 | 182 |
| 31.01.2024 | 182 | 186 | 170 |
© Bayerisches Landesamt für Umwelt 2024