
- Start >
- Rivers >
- Waterlevel >
- Oberer Main - Elbe >
- Hohenberg >
- Chart of year

Chart of year Hohenberg / Eger
Waterlevel from 25.04.2024 to 24.04.2025
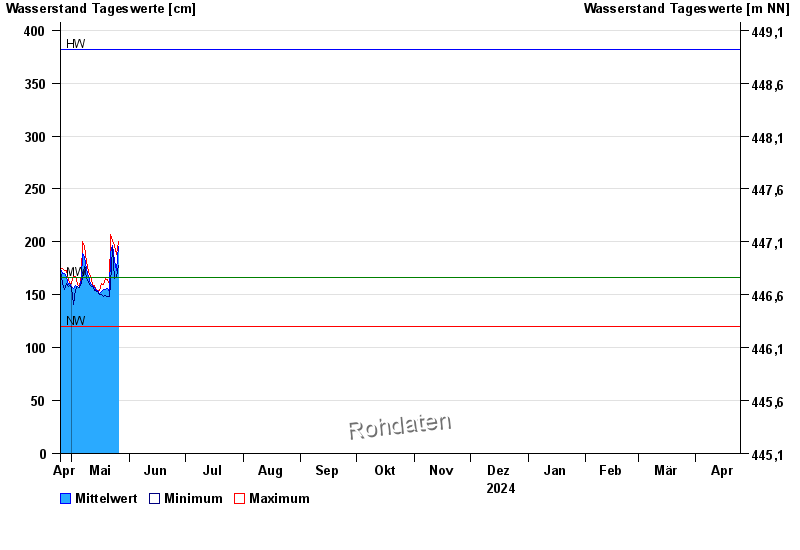
| Date | Mean value [cm] | Maximum [cm] | Minimum [cm] |
|---|---|---|---|
| 05.05.2024 | 157 | 158 | 157 |
| 04.05.2024 | 158 | 160 | 158 |
| 03.05.2024 | 159 | 167 | 155 |
| 02.05.2024 | 156 | 168 | 141 |
| 01.05.2024 | 158 | 161 | 157 |
| 30.04.2024 | 161 | 162 | 159 |
| 29.04.2024 | 160 | 164 | 158 |
© Bayerisches Landesamt für Umwelt 2024