
- Start >
- Rivers >
- Waterlevel >
- Oberer Main - Elbe >
- Hallerndorf >
- Chart of year

Chart of year Hallerndorf / Aisch
Waterlevel from 30.03.2024 to 29.03.2025
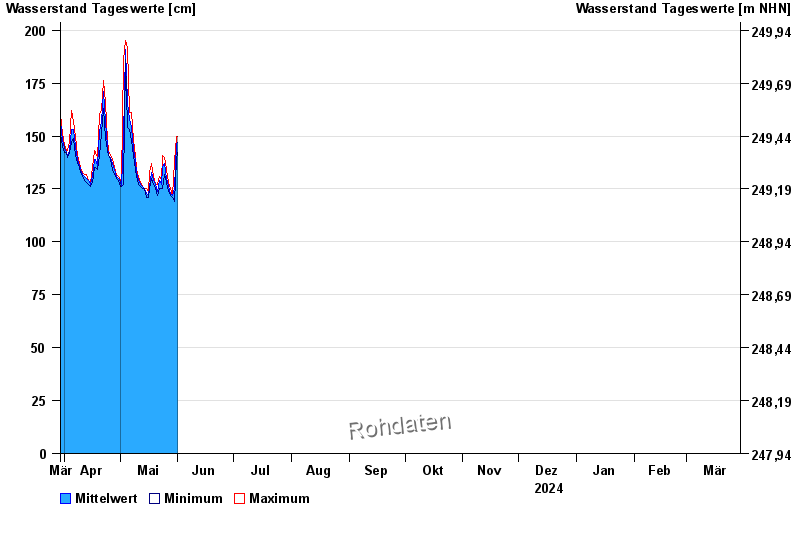
| Date | Mean value [cm] | Maximum [cm] | Minimum [cm] |
|---|---|---|---|
| 09.05.2024 | 139 | 141 | 136 |
| 08.05.2024 | 144 | 148 | 141 |
| 07.05.2024 | 154 | 161 | 148 |
| 06.05.2024 | 158 | 161 | 153 |
| 05.05.2024 | 166 | 192 | 154 |
| 04.05.2024 | 191 | 195 | 186 |
| 03.05.2024 | 149 | 186 | 127 |
© Bayerisches Landesamt für Umwelt 2024