
- Start >
- Rivers >
- Waterlevel >
- Oberer Main - Elbe >
- Grafenwöhr >
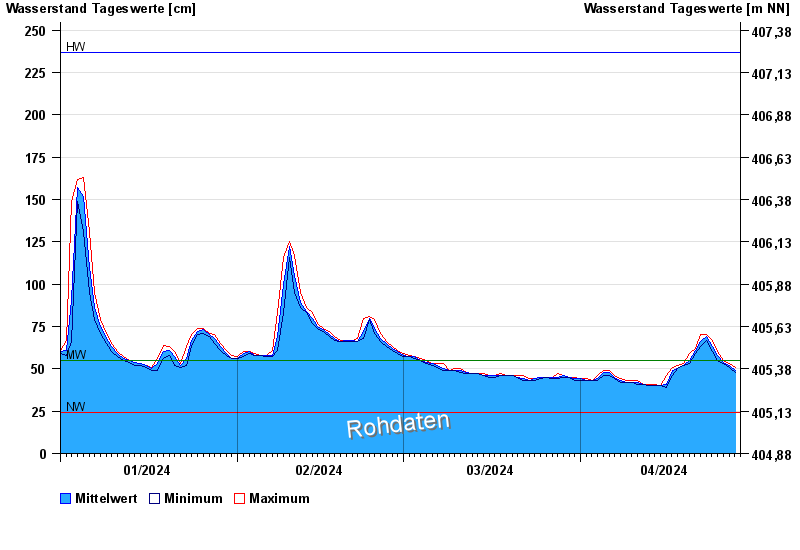
- Chart of year

Chart of year Grafenwöhr / Creußen
Waterlevel from 01.01.2024 to 28.04.2024
| Date | Mean value [cm] | Maximum [cm] | Minimum [cm] |
|---|---|---|---|
| 28.04.2024 | 50 | 51 | 49 |
| 27.04.2024 | 52 | 53 | 51 |
| 26.04.2024 | 54 | 55 | 53 |
| 25.04.2024 | 58 | 60 | 55 |
| 24.04.2024 | 63 | 67 | 60 |
| 23.04.2024 | 69 | 70 | 67 |
| 22.04.2024 | 66 | 70 | 63 |
© Bayerisches Landesamt für Umwelt 2024