
- Start >
- Rivers >
- Waterlevel >
- Oberer Main - Elbe >
- Grafenwöhr >
- Chart of total period

Chart of total period Grafenwöhr / Creußen
Waterlevel from 01.11.1969 to 08.05.2024
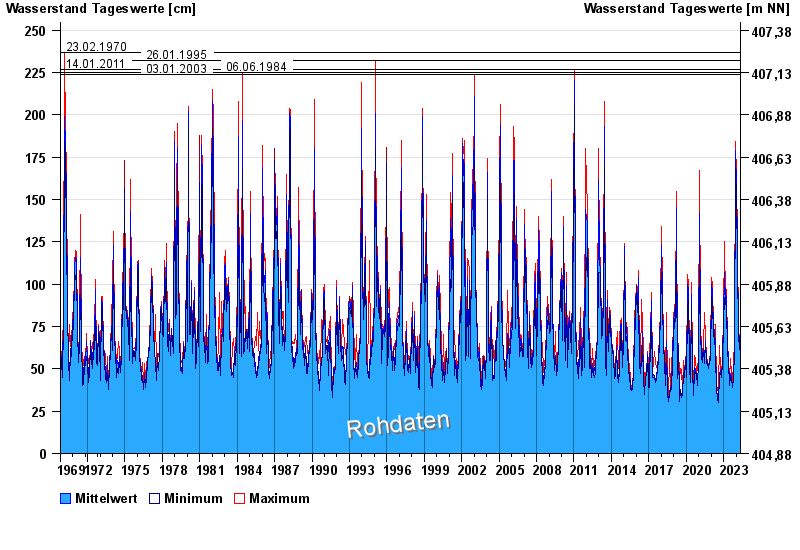
- 23.02.1970 Wasserstand: 237 cm
- 26.01.1995 Wasserstand: 232 cm
- 14.01.2011 Wasserstand: 227 cm
- 06.06.1984 Wasserstand: 225 cm
- 03.01.2003 Wasserstand: 224 cm
| Date | Mean value [cm] | Maximum [cm] | Minimum [cm] |
|---|---|---|---|
| 08.05.2024 | 46 | 46 | 46 |
| 07.05.2024 | 45 | 46 | 44 |
| 06.05.2024 | 43 | 44 | 42 |
| 05.05.2024 | 42 | 42 | 42 |
| 04.05.2024 | 43 | 44 | 42 |
| 03.05.2024 | 45 | 45 | 43 |
| 02.05.2024 | 43 | 43 | 43 |
© Bayerisches Landesamt für Umwelt 2024