
- Start >
- Rivers >
- Waterlevel >
- Oberer Main - Elbe >
- Goldbergsee Ablauf >
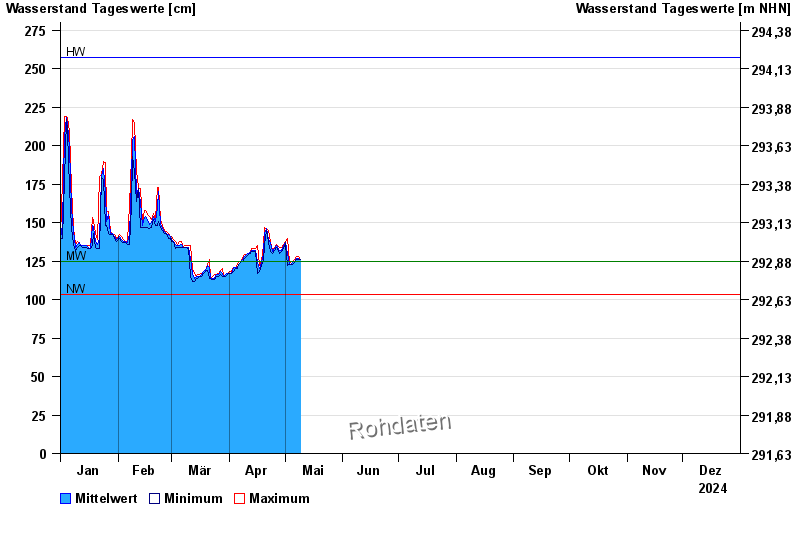
- Chart of year

Chart of year Goldbergsee Ablauf / Sulzbach
Waterlevel from 01.01.2024 to 31.12.2024
note
Beeinflussung des Abflusses aufgrund Hindernisse im Unterlauf.
| Date | Mean value [cm] | Maximum [cm] | Minimum [cm] |
|---|---|---|---|
| 19.05.2024 | 131 | 134 | 127 |
| 18.05.2024 | 126 | 127 | 123 |
| 17.05.2024 | 122 | 123 | 120 |
| 16.05.2024 | 122 | 126 | 120 |
| 15.05.2024 | 120 | 121 | 119 |
| 14.05.2024 | 121 | 121 | 120 |
| 13.05.2024 | 122 | 123 | 121 |
© Bayerisches Landesamt für Umwelt 2024