
- Start >
- Rivers >
- Waterlevel >
- Oberer Main - Elbe >
- Füssen >
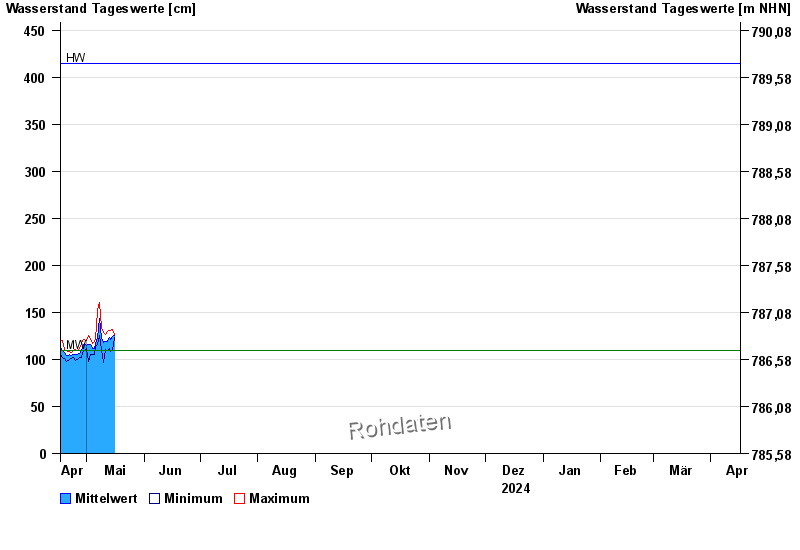
- Chart of year

Chart of year Füssen / Lech
Waterlevel from 17.04.2024 to 16.04.2025
| Date | Mean value [cm] | Maximum [cm] | Minimum [cm] |
|---|---|---|---|
| 01.06.2024 | 196 | 196 | 195 |
| 31.05.2024 | 171 | 198 | 146 |
| 30.05.2024 | 126 | 145 | 115 |
| 29.05.2024 | 118 | 123 | 112 |
| 28.05.2024 | 128 | 139 | 121 |
| 27.05.2024 | 119 | 125 | 115 |
| 26.05.2024 | 116 | 128 | 110 |
© Bayerisches Landesamt für Umwelt 2024