
- Start >
- Rivers >
- Waterlevel >
- Oberer Main - Elbe >
- Friedersreuth >
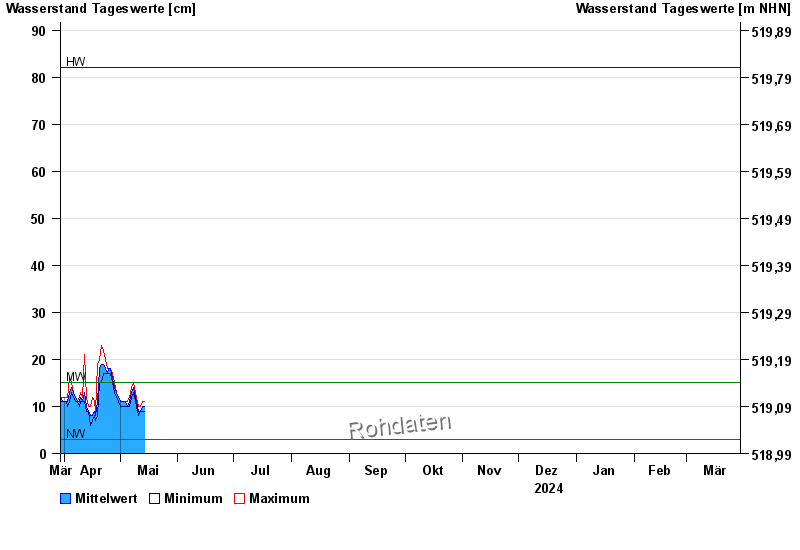
- Chart of year

Chart of year Friedersreuth / Schweinnaab
Waterlevel from 30.03.2024 to 29.03.2025
| Date | Mean value [cm] | Maximum [cm] | Minimum [cm] |
|---|---|---|---|
| 28.05.2024 | 23 | 25 | 21 |
| 27.05.2024 | 23 | 25 | 21 |
| 26.05.2024 | 30 | 38 | 25 |
| 25.05.2024 | 27 | 42 | 19 |
| 24.05.2024 | 23 | 24 | 21 |
| 23.05.2024 | 28 | 33 | 24 |
| 22.05.2024 | 36 | 42 | 27 |
© Bayerisches Landesamt für Umwelt 2024