
- Start >
- Rivers >
- Waterlevel >
- Oberer Main - Elbe >
- Förmitz Speicherzufluss >
- Chart of year

Chart of year Förmitz Speicherzufluss / Förmitz
Waterlevel from 30.03.2024 to 29.03.2025
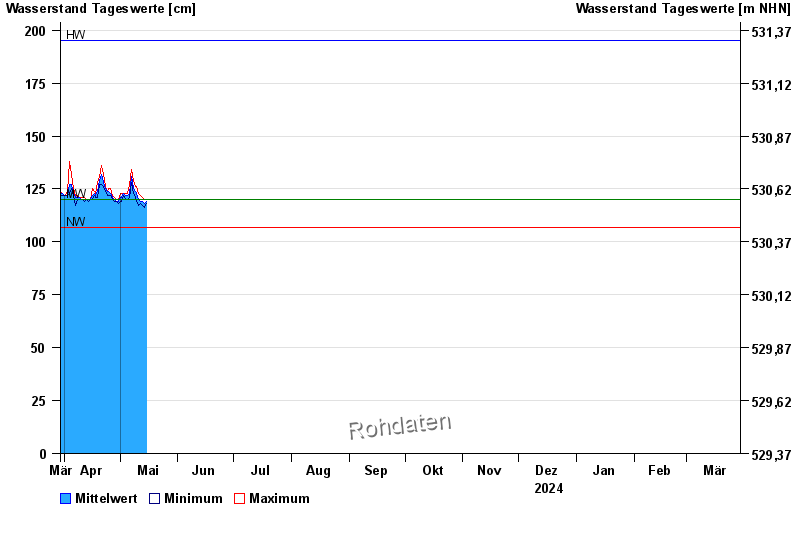
| Date | Mean value [cm] | Maximum [cm] | Minimum [cm] |
|---|---|---|---|
| 15.05.2024 | 119 | 120 | 118 |
| 14.05.2024 | 118 | 120 | 116 |
| 13.05.2024 | 119 | 121 | 117 |
| 12.05.2024 | 119 | 122 | 118 |
| 11.05.2024 | 120 | 123 | 117 |
| 10.05.2024 | 123 | 126 | 119 |
| 09.05.2024 | 124 | 126 | 121 |
© Bayerisches Landesamt für Umwelt 2024