
- Start >
- Rivers >
- Waterlevel >
- Oberer Main - Elbe >
- Erlabrück >
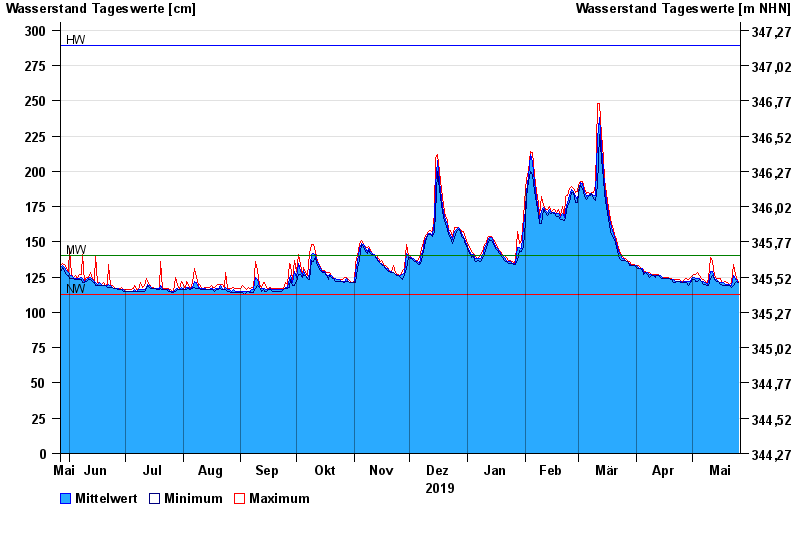
- Chart of year

Chart of year Erlabrück / Rodach
Waterlevel from 27.05.2019 to 26.05.2020
| Date | Mean value [cm] | Maximum [cm] | Minimum [cm] |
|---|---|---|---|
| 26.05.2020 | 121 | 122 | 121 |
| 25.05.2020 | 123 | 124 | 122 |
| 24.05.2020 | 123 | 127 | 121 |
| 23.05.2020 | 126 | 134 | 119 |
| 22.05.2020 | 119 | 121 | 118 |
| 21.05.2020 | 120 | 120 | 119 |
| 20.05.2020 | 120 | 121 | 119 |
© Bayerisches Landesamt für Umwelt 2024