
- Start >
- Rivers >
- Waterlevel >
- Oberer Main - Elbe >
- Erlabrück >
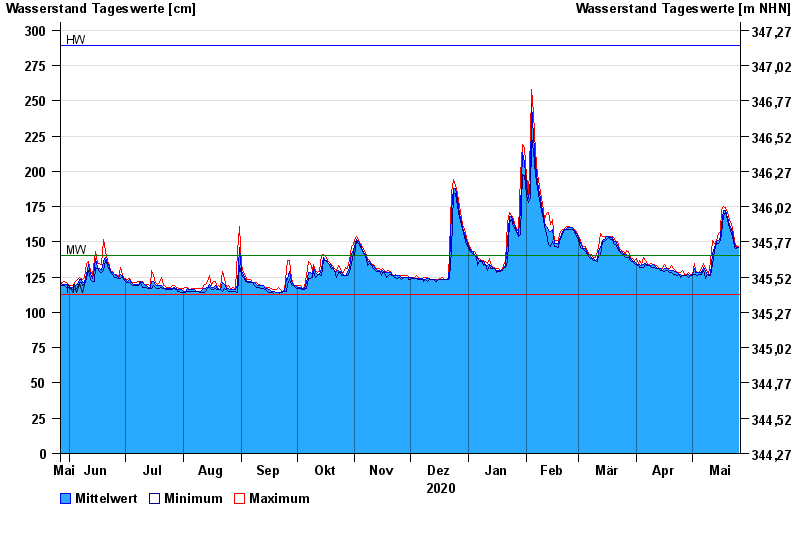
- Chart of year

Chart of year Erlabrück / Rodach
Waterlevel from 27.05.2020 to 26.05.2021
| Date | Mean value [cm] | Maximum [cm] | Minimum [cm] |
|---|---|---|---|
| 26.05.2021 | 146 | 147 | 146 |
| 25.05.2021 | 146 | 147 | 145 |
| 24.05.2021 | 148 | 150 | 146 |
| 23.05.2021 | 153 | 156 | 150 |
| 22.05.2021 | 159 | 163 | 156 |
| 21.05.2021 | 162 | 165 | 160 |
| 20.05.2021 | 167 | 171 | 165 |
© Bayerisches Landesamt für Umwelt 2024