
- Start >
- Rivers >
- Waterlevel >
- Oberer Main - Elbe >
- Erlabrück >
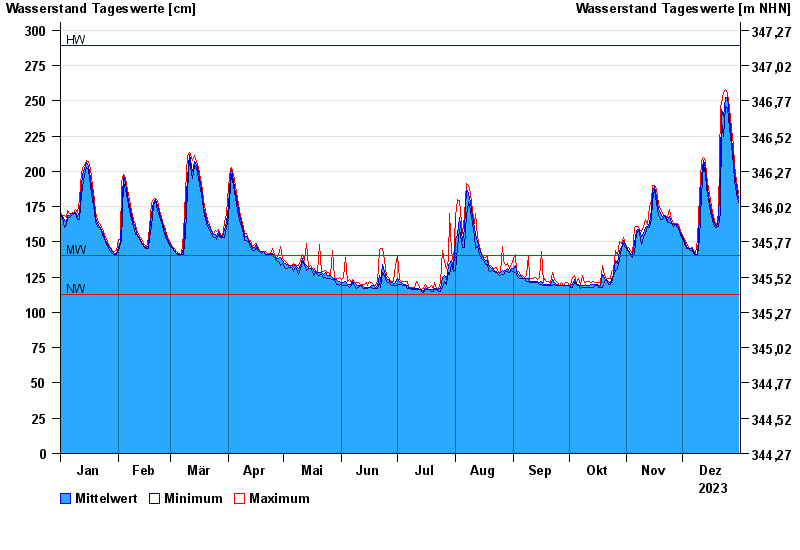
- Chart of year

Chart of year Erlabrück / Rodach
Waterlevel from 01.01.2023 to 31.12.2023
| Date | Mean value [cm] | Maximum [cm] | Minimum [cm] |
|---|---|---|---|
| 31.12.2023 | 181 | 184 | 178 |
| 30.12.2023 | 189 | 193 | 184 |
| 29.12.2023 | 198 | 204 | 193 |
| 28.12.2023 | 211 | 218 | 204 |
| 27.12.2023 | 223 | 230 | 218 |
| 26.12.2023 | 238 | 245 | 230 |
| 25.12.2023 | 252 | 255 | 245 |
© Bayerisches Landesamt für Umwelt 2024