
- Start >
- Rivers >
- Waterlevel >
- Oberer Main - Elbe >
- Erbendorf >
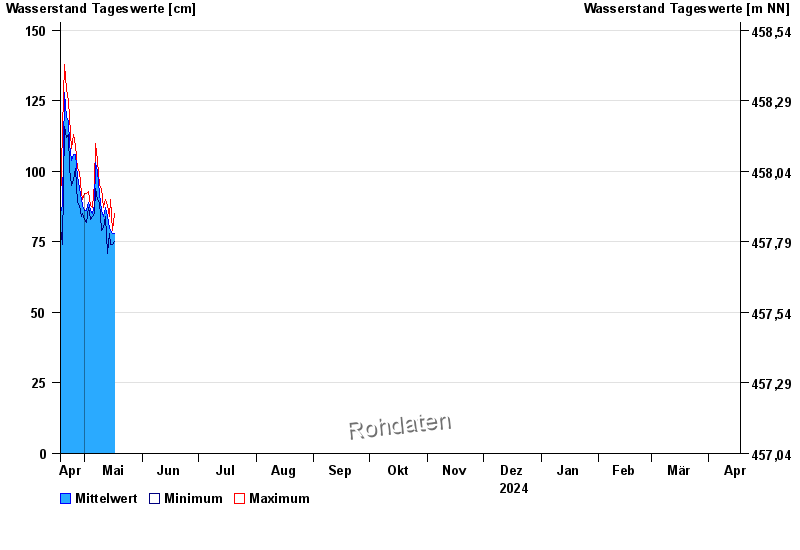
- Chart of year

Chart of year Erbendorf / Fichtelnaab
Waterlevel from 18.04.2024 to 17.04.2025
| Date | Mean value [cm] | Maximum [cm] | Minimum [cm] |
|---|---|---|---|
| 21.05.2024 | 82 | 82 | 81 |
| 20.05.2024 | 83 | 86 | 79 |
| 19.05.2024 | 84 | 88 | 80 |
| 18.05.2024 | 87 | 91 | 84 |
| 17.05.2024 | 80 | 88 | 75 |
| 16.05.2024 | 78 | 79 | 74 |
| 15.05.2024 | 79 | 90 | 74 |
© Bayerisches Landesamt für Umwelt 2024