
- Start >
- Rivers >
- Waterlevel >
- Oberer Main - Elbe >
- Erbendorf >
- Chart of year

Chart of year Erbendorf / Fichtelnaab
Waterlevel from 01.01.2024 to 31.12.2024
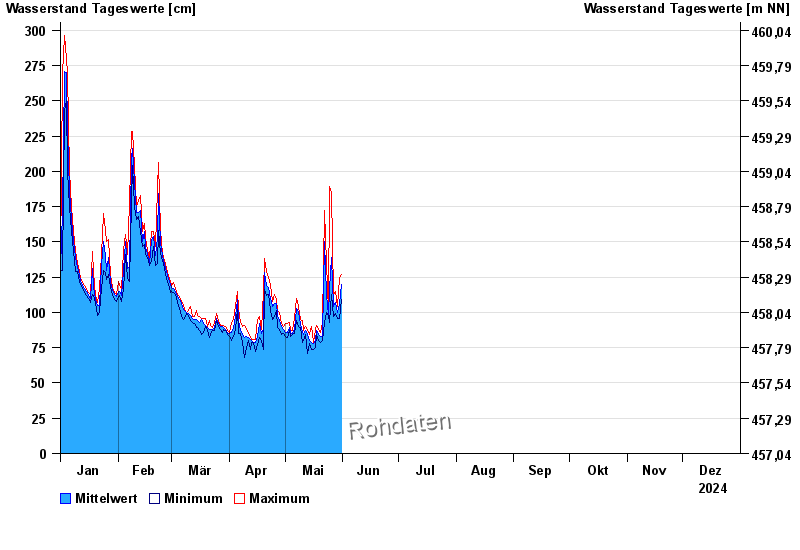
| Date | Mean value [cm] | Maximum [cm] | Minimum [cm] |
|---|---|---|---|
| 07.06.2024 | 92 | 95 | 87 |
| 06.06.2024 | 95 | 97 | 93 |
| 05.06.2024 | 98 | 105 | 87 |
| 04.06.2024 | 104 | 109 | 96 |
| 03.06.2024 | 116 | 125 | 108 |
| 02.06.2024 | 126 | 129 | 123 |
| 01.06.2024 | 111 | 136 | 105 |
© Bayerisches Landesamt für Umwelt 2024