
- Start >
- Rivers >
- Waterlevel >
- Oberer Main - Elbe >
- Coburg >
- Chart of year

Chart of year Coburg / Itz
Waterlevel from 08.05.2020 to 07.05.2021
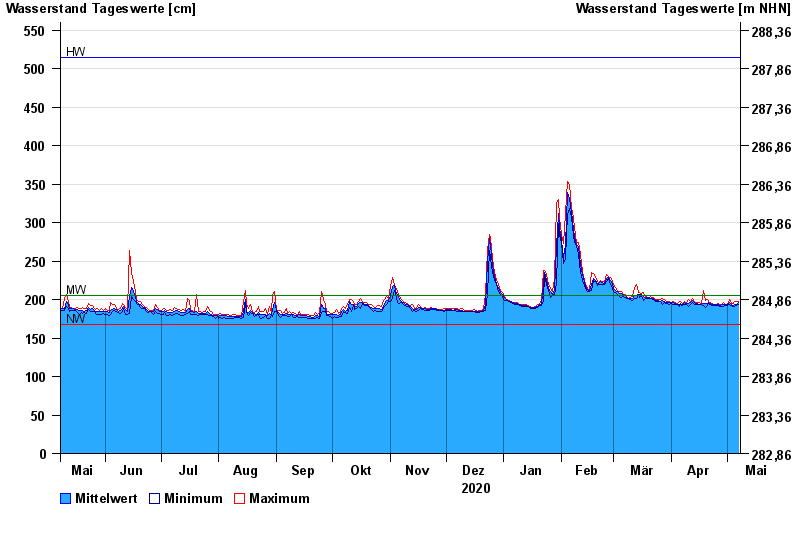
| Date | Mean value [cm] | Maximum [cm] | Minimum [cm] |
|---|---|---|---|
| 07.05.2021 | 196 | 198 | 194 |
| 06.05.2021 | 194 | 197 | 192 |
| 05.05.2021 | 193 | 198 | 191 |
| 04.05.2021 | 192 | 195 | 191 |
| 03.05.2021 | 194 | 195 | 192 |
| 02.05.2021 | 196 | 200 | 194 |
| 01.05.2021 | 193 | 194 | 192 |
© Bayerisches Landesamt für Umwelt 2024