
- Start >
- Rivers >
- Waterlevel >
- Oberer Main - Elbe >
- Coburg >
- Chart of year

Chart of year Coburg / Itz
Waterlevel from 05.03.2021 to 04.03.2022
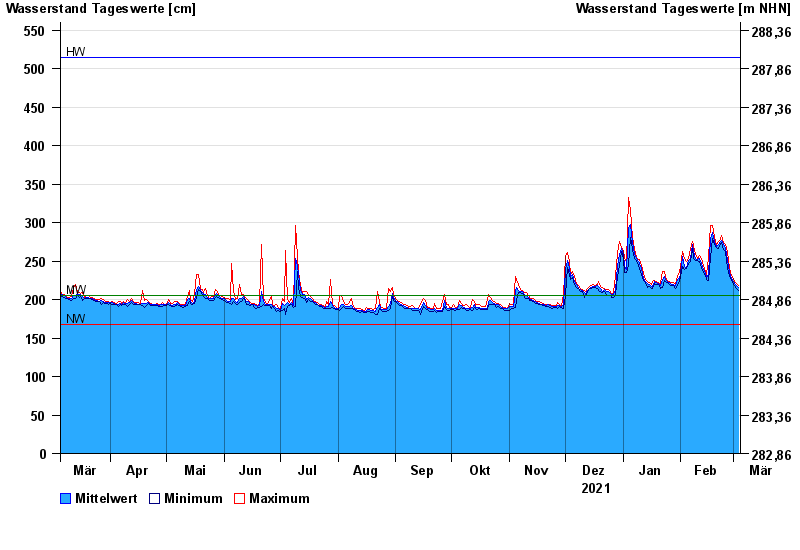
| Date | Mean value [cm] | Maximum [cm] | Minimum [cm] |
|---|---|---|---|
| 04.03.2022 | 216 | 218 | 212 |
| 03.03.2022 | 218 | 221 | 214 |
| 02.03.2022 | 221 | 224 | 218 |
| 01.03.2022 | 224 | 228 | 220 |
| 28.02.2022 | 228 | 231 | 225 |
| 27.02.2022 | 235 | 241 | 230 |
| 26.02.2022 | 252 | 263 | 241 |
© Bayerisches Landesamt für Umwelt 2024