
- Start >
- Rivers >
- Waterlevel >
- Oberer Main - Elbe >
- Bad Berneck >
- Chart of total period

Chart of total period Bad Berneck / Ölschnitz
Waterlevel from 01.11.1981 to 28.04.2024
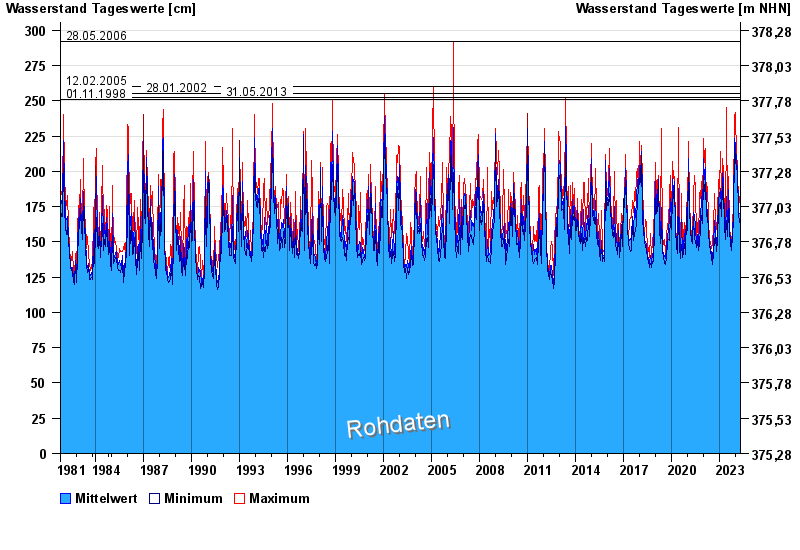
- 28.05.2006 Wasserstand: 292 cm
- 12.02.2005 Wasserstand: 260 cm
- 28.01.2002 Wasserstand: 255 cm
- 31.05.2013 Wasserstand: 252 cm
- 01.11.1998 Wasserstand: 251 cm
| Date | Mean value [cm] | Maximum [cm] | Minimum [cm] |
|---|---|---|---|
| 28.04.2024 | 159 | 159 | 158 |
| 27.04.2024 | 160 | 161 | 159 |
| 26.04.2024 | 162 | 163 | 161 |
| 25.04.2024 | 162 | 164 | 162 |
| 24.04.2024 | 163 | 164 | 162 |
| 23.04.2024 | 164 | 166 | 163 |
| 22.04.2024 | 168 | 175 | 165 |
© Bayerisches Landesamt für Umwelt 2024