
- Start >
- Rivers >
- Waterlevel >
- Oberer Main - Elbe >
- Arzberg >
- Chart of total period

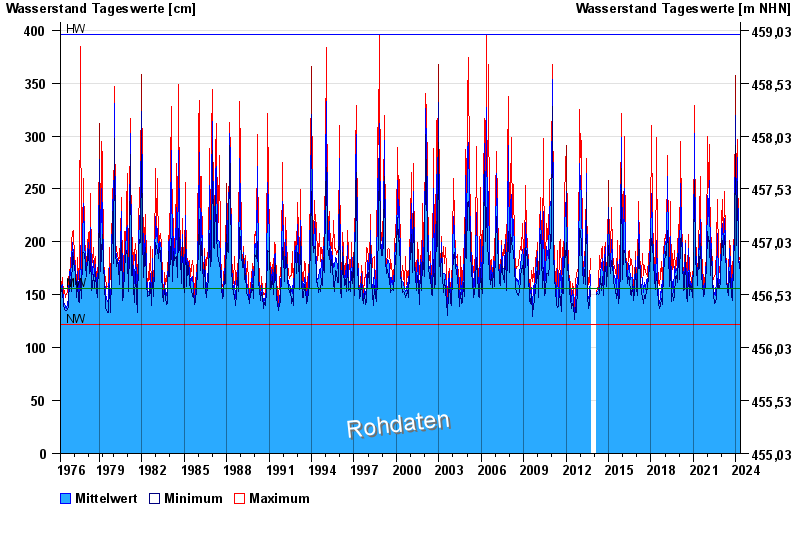
Chart of total period Arzberg / Röslau
Waterlevel from 05.04.1976 to 01.05.2024
| Date | Mean value [cm] | Maximum [cm] | Minimum [cm] |
|---|---|---|---|
| 01.05.2024 | 156 | 156 | 154 |
| 30.04.2024 | 157 | 158 | 156 |
| 29.04.2024 | 158 | 159 | 157 |
| 28.04.2024 | 160 | 161 | 159 |
| 27.04.2024 | 163 | 164 | 161 |
| 26.04.2024 | 165 | 166 | 164 |
| 25.04.2024 | 166 | 166 | 165 |
© Bayerisches Landesamt für Umwelt 2024