
- Start >
- Rivers >
- Waterlevel >
- Bayern >
- Trunstadt >
- Chart of year

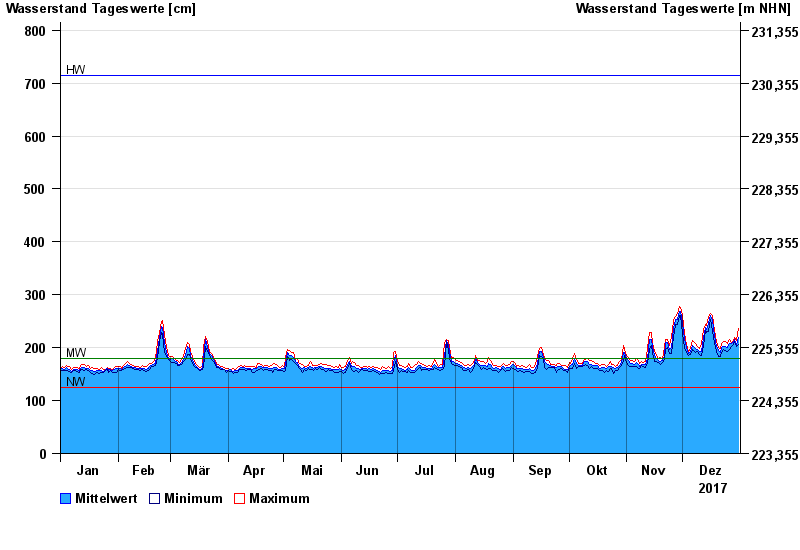
Chart of year Trunstadt / Main
Waterlevel from 01.01.2017 to 31.12.2017
| Date | Mean value [cm] | Maximum [cm] | Minimum [cm] |
|---|---|---|---|
| 31.12.2017 | 219 | 236 | 206 |
| 30.12.2017 | 206 | 213 | 202 |
| 29.12.2017 | 216 | 220 | 212 |
| 28.12.2017 | 209 | 214 | 206 |
| 27.12.2017 | 207 | 210 | 203 |
| 26.12.2017 | 207 | 215 | 197 |
| 25.12.2017 | 201 | 207 | 192 |
© Bayerisches Landesamt für Umwelt 2024