
- Start >
- Rivers >
- Waterlevel >
- Bayern >
- Trunstadt >
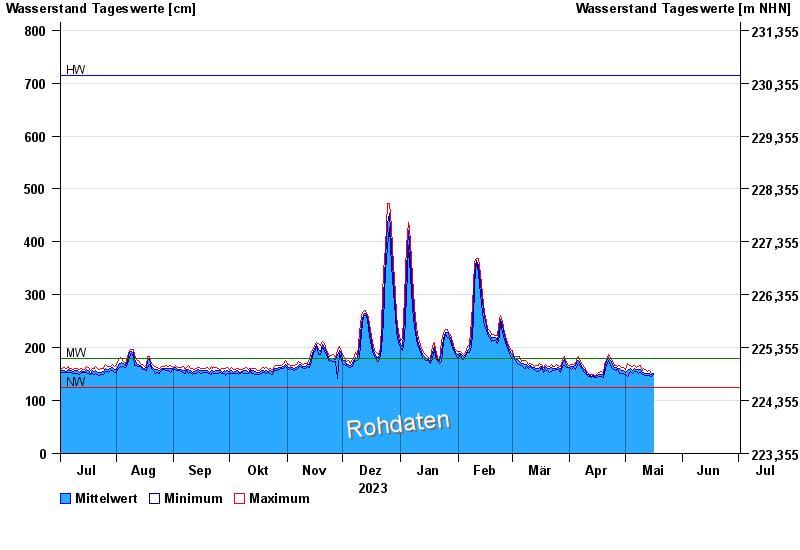
- Chart of year

Chart of year Trunstadt / Main
Waterlevel from 02.07.2023 to 01.07.2024
| Date | Mean value [cm] | Maximum [cm] | Minimum [cm] |
|---|---|---|---|
| 17.05.2024 | 162 | 162 | 162 |
| 16.05.2024 | 151 | 161 | 146 |
| 15.05.2024 | 150 | 152 | 146 |
| 14.05.2024 | 151 | 156 | 147 |
| 13.05.2024 | 151 | 155 | 148 |
| 12.05.2024 | 152 | 158 | 147 |
| 11.05.2024 | 154 | 161 | 149 |
© Bayerisches Landesamt für Umwelt 2024