
- Start >
- Rivers >
- Waterlevel >
- Bayern >
- Oberndorf >
- Chart of year

Chart of year Oberndorf / Donau
Waterlevel from 01.01.2021 to 31.12.2021
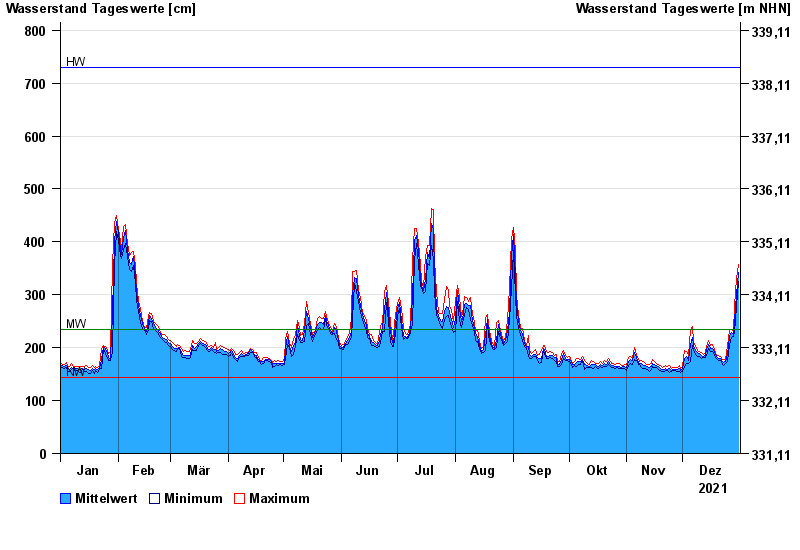
| Date | Mean value [cm] | Maximum [cm] | Minimum [cm] |
|---|---|---|---|
| 31.12.2021 | 343 | 358 | 326 |
| 30.12.2021 | 301 | 330 | 278 |
| 29.12.2021 | 251 | 278 | 228 |
| 28.12.2021 | 226 | 231 | 222 |
| 27.12.2021 | 229 | 234 | 219 |
| 26.12.2021 | 221 | 232 | 205 |
| 25.12.2021 | 188 | 205 | 174 |
© Bayerisches Landesamt für Umwelt 2024