
- Start >
- Rivers >
- Waterlevel >
- Bayern >
- Heinersdorf >
- Chart of year

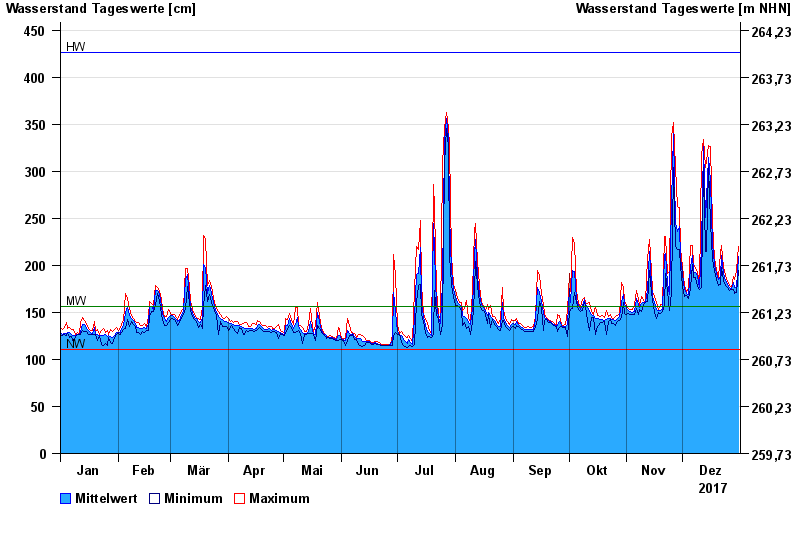
Chart of year Heinersdorf / Rodach
Waterlevel from 01.01.2017 to 31.12.2017
| Date | Mean value [cm] | Maximum [cm] | Minimum [cm] |
|---|---|---|---|
| 31.12.2017 | 209 | 220 | 195 |
| 30.12.2017 | 176 | 195 | 171 |
| 29.12.2017 | 177 | 185 | 170 |
| 28.12.2017 | 182 | 188 | 174 |
| 27.12.2017 | 175 | 177 | 174 |
| 26.12.2017 | 177 | 179 | 173 |
| 25.12.2017 | 180 | 183 | 177 |
© Bayerisches Landesamt für Umwelt 2024