
- Start >
- Rivers >
- Waterlevel >
- Bayern >
- Fürth am Berg >
- Chart of year

Chart of year Fürth am Berg / Steinach
Waterlevel from 01.01.2024 to 31.12.2024
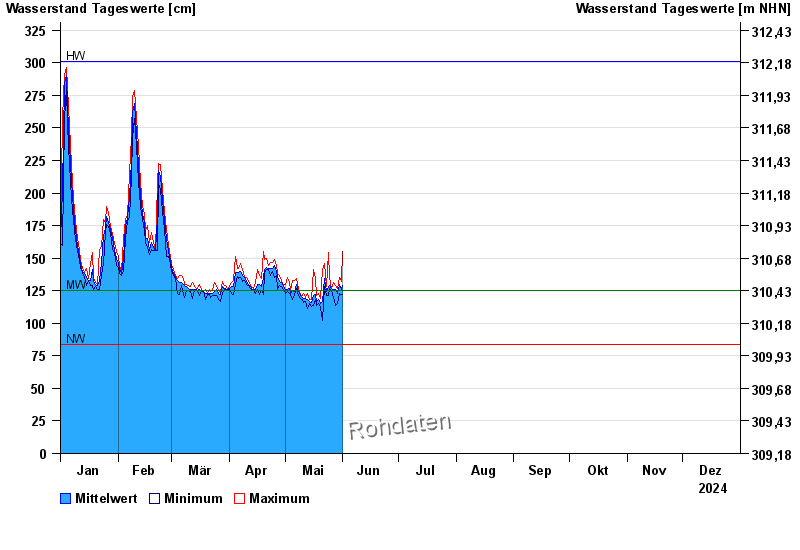
| Date | Mean value [cm] | Maximum [cm] | Minimum [cm] |
|---|---|---|---|
| 31.12.2024 | 134 | 136 | 132 |
| 30.12.2024 | 138 | 140 | 135 |
| 29.12.2024 | 143 | 146 | 140 |
| 28.12.2024 | 149 | 159 | 132 |
| 27.12.2024 | 157 | 161 | 152 |
| 26.12.2024 | 166 | 172 | 161 |
| 25.12.2024 | 178 | 185 | 172 |
© Bayerisches Landesamt für Umwelt 2025