
- Start >
- Rivers >
- Waterlevel >
- Bayern >
- Bad Wiessee >
- Chart of year

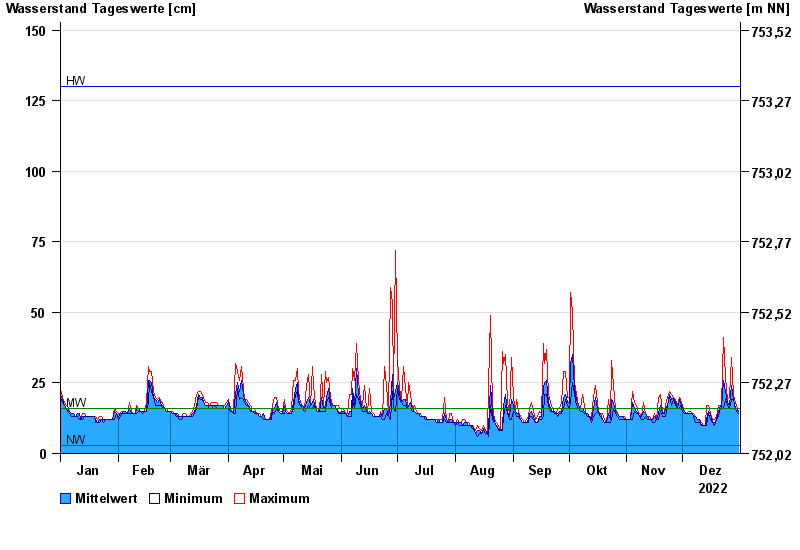
Chart of year Bad Wiessee / Zeiselbach
Waterlevel from 01.01.2022 to 31.12.2022
| Date | Mean value [cm] | Maximum [cm] | Minimum [cm] |
|---|---|---|---|
| 31.12.2022 | 15 | 15 | 14 |
| 30.12.2022 | 16 | 17 | 15 |
| 29.12.2022 | 17 | 19 | 17 |
| 28.12.2022 | 19 | 21 | 19 |
| 27.12.2022 | 24 | 34 | 19 |
| 26.12.2022 | 17 | 20 | 16 |
| 25.12.2022 | 18 | 19 | 17 |
© Bayerisches Landesamt für Umwelt 2024