
- Start >
- Rivers >
- Waterlevel >
- Bayern >
- Bad Aibling >
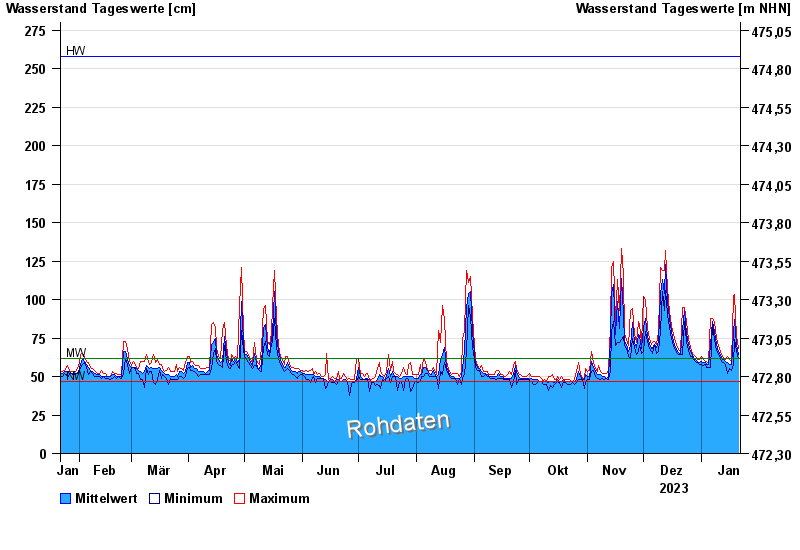
- Chart of year

Chart of year Bad Aibling / Glonn
Waterlevel from 22.01.2023 to 21.01.2024
| Date | Mean value [cm] | Maximum [cm] | Minimum [cm] |
|---|---|---|---|
| 21.01.2024 | 64 | 68 | 62 |
| 20.01.2024 | 71 | 76 | 66 |
| 19.01.2024 | 87 | 103 | 74 |
| 18.01.2024 | 78 | 102 | 58 |
| 17.01.2024 | 58 | 60 | 54 |
| 16.01.2024 | 58 | 61 | 55 |
| 15.01.2024 | 59 | 63 | 52 |
© Bayerisches Landesamt für Umwelt 2024