
- Start >
- Rivers >
- Suspended sediment >
- Obere Donau >
- Staudach >
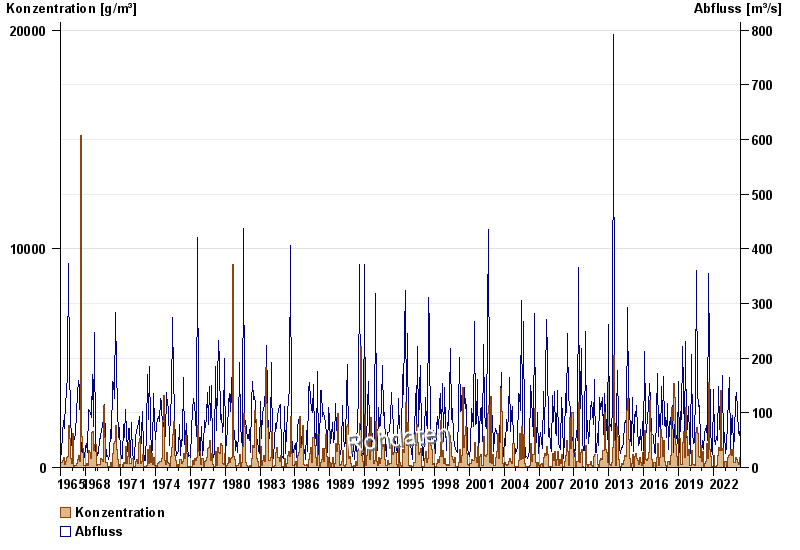
- Chart of total period

Chart of total period Staudach / Tiroler Achen
Suspended sediment from 31.10.1965 to 01.05.2024
| Date | concentration [g/m³] | Runoff [m³/s] |
|---|---|---|
| 01.05.2024 | 22.5 | 42.7 |
| 30.04.2024 | 17.3 | 45.0 |
| 29.04.2024 | 90.7 | 48.2 |
| 28.04.2024 | 24.1 | 48.7 |
| 27.04.2024 | 16.0 | 41.5 |
| 26.04.2024 | 44.8 | 34.9 |
| 25.04.2024 | 39.9 | 33.5 |
© Bayerisches Landesamt für Umwelt 2024