
- Start >
- Rivers >
- Suspended sediment >
- Isar >
- Eschelbach >
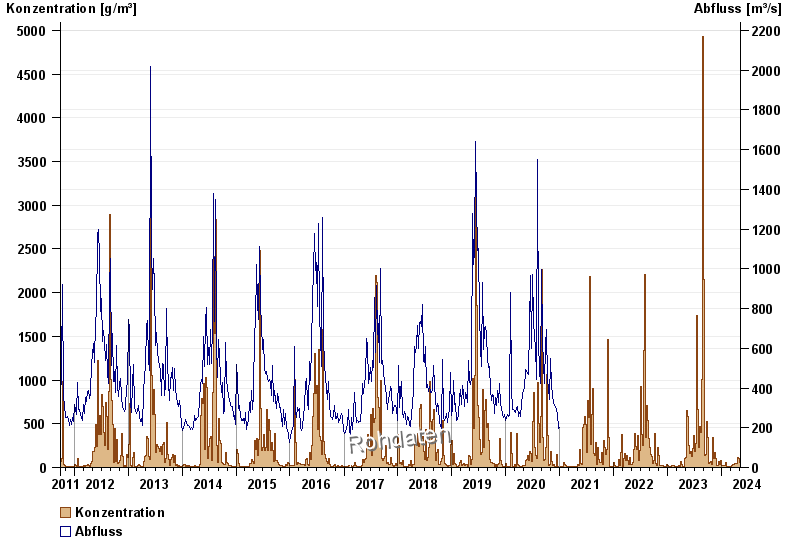
- Chart of total period

Chart of total period Eschelbach / Inn
Suspended sediment from 30.09.2011 to 08.05.2024
| Date | concentration [g/m³] | Runoff [m³/s] |
|---|---|---|
| 08.05.2024 | 58.3 | 0.0 |
| 07.05.2024 | 62.0 | 0.0 |
| 06.05.2024 | 124.1 | 0.0 |
| 05.05.2024 | 51.6 | 0.0 |
| 04.05.2024 | 26.3 | 0.0 |
| 03.05.2024 | 32.5 | 0.0 |
| 02.05.2024 | 44.4 | 0.0 |
© Bayerisches Landesamt für Umwelt 2024