
- Start >
- Rivers >
- Suspended sediment >
- Inn >
- Donauwörth >
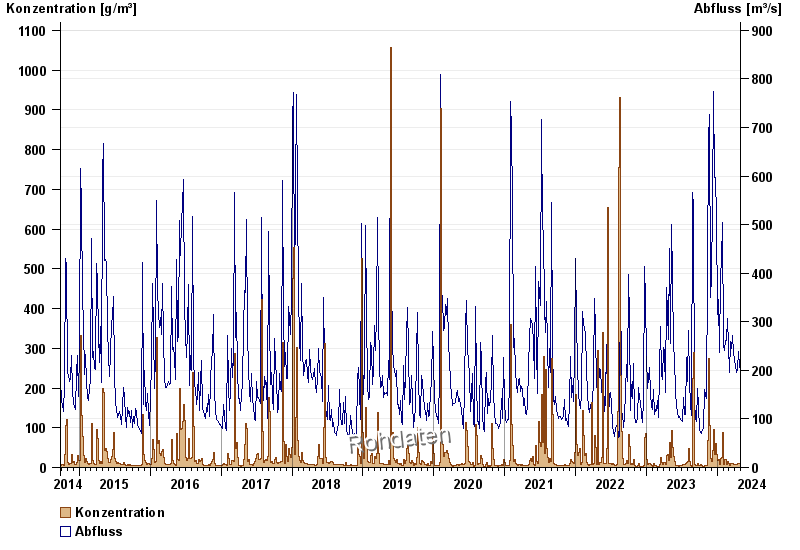
- Chart of total period

Chart of total period Donauwörth / Donau
Suspended sediment from 25.09.2014 to 29.04.2024
| Date | concentration [g/m³] | Runoff [m³/s] |
|---|---|---|
| 29.04.2024 | 12.6 | 203.0 |
| 28.04.2024 | 11.6 | 189.0 |
| 27.04.2024 | 10.7 | 178.0 |
| 26.04.2024 | 9.9 | 180.0 |
| 25.04.2024 | 9.8 | 184.0 |
| 24.04.2024 | 9.8 | 191.0 |
| 23.04.2024 | 9.6 | 205.0 |
© Bayerisches Landesamt für Umwelt 2024