
- Start >
- Rivers >
- Discharge >
- Regnitz >
- Weinzierlein >
- Chart of year

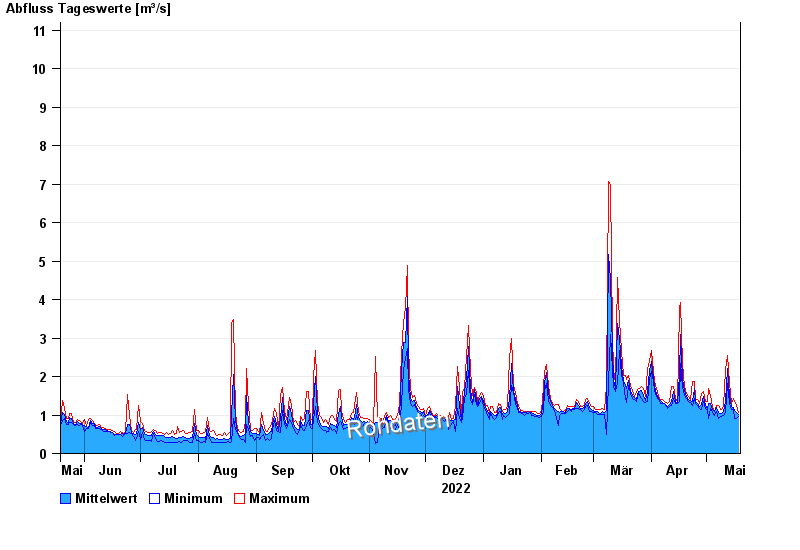
Chart of year Weinzierlein / Bibert
Discharge from 19.05.2022 to 18.05.2023
- 08.01.2011 Abfluss: 41,5 m³/s
- 14.01.2011 Abfluss: 24,7 m³/s
- 01.06.2013 Abfluss: 22,9 m³/s
- 09.12.2010 Abfluss: 20,9 m³/s
- 22.01.2012 Abfluss: 17,3 m³/s
| Date | Mean value [m³/s] | Maximum [m³/s] | Minimum [m³/s] |
|---|---|---|---|
| 18.05.2023 | 1.02 | 1.06 | 0.951 |
| 17.05.2023 | 1.07 | 1.25 | 0.913 |
| 16.05.2023 | 1.11 | 1.36 | 0.913 |
| 15.05.2023 | 1.2 | 1.44 | 1.14 |
| 14.05.2023 | 1.23 | 1.29 | 1.14 |
| 13.05.2023 | 1.51 | 1.82 | 1.29 |
| 12.05.2023 | 2.22 | 2.54 | 1.82 |
© Bayerisches Landesamt für Umwelt 2024